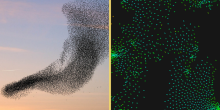
In the study of social networks, a key phenomena is the diffusion of information – how it travels from one individual to another across the network of people. An important question in the study of information diffusion is how to identify the most influential nodes – nodes with a high potential to spread information widely and deeper in the network.
In real-life (offline) social networks, information diffuses through face-to-face dialogue, a process often referred to as word-of-mouth diffusion. This process is reminiscent of the game of Chinese whispers (or telephone game), where players sit in a circle, and the first person whispers a message to the next. Each participant then whispers what they heard to their neighbor, and so on around the circle. By the time the message returns to the start, it has often transformed dramatically, much to the amusement of all. In a more general context, we call this information decay.
In the digital age, however, social media networks facilitate a different mode of information travel. Users often share posts verbatim, replicating content without alteration.
Our new study, published in Research Policy introduces a novel measure, neighborhood centrality, to quantitatively analyse both kinds of diffusion. The trick is a new parameter that can be interpreted in two ways, depending on the context: as a measure of information decay, or as a probability of verbatim information sharing.
Why we needed a new centrality measure
In our setting, which we come back to later, we study the information diffusion through word-of-mouth among academics. One tells the other about a new paper, and might miss something. Thus some share of the information is lost, just like in Chinese whispers.
Existing measures of node importance do not consider information decay, which are fundamental to many diffusion processes. Prominent measures of node importance include eigenvector centrality,Katz-Bonacich centrality, and diffusion centrality. These capture node influence in strategic interactions where a pair of nodes can exchange the same piece of information between them ad infinitum. In a previous article, written by Manish Pandey, you can read more about centrality measures and their importance.
Neighbourhood Centrality
What makes neighbourhood centrality widely applicable is a parameter, , which can be interpreted as an information decay parameter in word-of-mouth diffusion processes, and as a probability of information passage in diffusion processes that do not involve face-to-face dialogues (e.g., diffusion in social media platforms). Like in Chinese whispers, a person does not fully understand the issue, or something is lost. That’s what we capture with 𝛿. Alternatively, information decay can be a result of topical distance to the first sender.
Neighbourhood centrality counts the number of all nodes within a given distance from a node, each distance step weighted by to the power of the distance.
Formally, let be the number of -th order neighbours of node . That is, is the number of all nodes at distance (measured as the number of links in the shortest path between a pair of nodes) from . For example, consists of all direct neighbours of , and are all neighbours of ’s direct neighbours.
The neighbourhood centrality, , of node is then the sum over all nodes, discounting for nodes at distance from . That is,
In word-of-mouth diffusion processes, is the extent to which the quality of information has decayed by the time it reaches a node at distance from . In diffusion processes that do not involve face-to-face dialogue, and information is shared verbatim, is the probability that a participant shares information with a neighbouring node. The probability that a piece of information seeding from node reaches a node at distance from , is then . In this setting, neighbourhood centrality, , of node is the sum, over all nodes, of the likelihood that a node at a given distance from receives information that seeded from .
Both the intuitive interpretation and the mathematical expression show that neighbourhood centrality extends beyond immediate ties to encompass the broader influence of a node within a network. It considers not only direct neighbours but also neighbours of neighbours, neighbours of neighbour’s neighbours, and so on.
When is small, nodes with the highest degree (direct neighbours) have the highest neighbourhood centrality. As increases towards one, the highest degree nodes will still have a high neighbourhood centrality, but not necessarily the highest. Nodes that are located between high-degree nodes, and those that have the shortest distance to all other nodes, become more important. When , all nodes have identical neighbourhood centrality because regardless of where information seeds from, it will eventually spread to all nodes.
As increases towards one nodes that are located between high-degree nodes, and those that have the shortest distance to all other nodes, become more important.
An example
To demonstrate how the ordering of neighbourhood centrality can vary with, consider a network depicted below.
A simple example of a non-homogeneous network. Nodes with the same colouring have the same number of neighbors.
The corresponding neighbourhood centralities are computed in the table below.
Node
0.1
0.3
0.5
0.8
0.95
1
0.12
0.52
1.30
4.25
7.48
2
0.31
1.04
2.09
5.11
7.83
3
0.23
0.96
2.19
5.47
7.99
4
0.23
0.96
2.19
5.47
7.99
5
0.34
1.31
2.75
5.98
8.17
6
0.43
1.51
2.94
6.04
8.18
7
0.13
0.66
1.72
4.99
7.82
8
0.13
0.66
1.72
4.99
7.82
9
0.23
0.93
2.09
5.28
7.91
10
0.11
0.49
1.30
4.39
7.56
When , the ordering of neighbourhood centrality correlates with the ordering of degree centrality. But as increases, we see a change in ordering. For example, node 2 ranks higher than node 3 when , but for , node 3 ranks higher than node 2. Similarly, when , node 1 ranks higher than node 10, but the order reverses as increases.
Application to information diffusion in science
Much like the gradual distortion of the message in Chinese whispers, our centrality measure models a diffusion process from a source, where at each step the next node receives only a fraction of the original information. This mimics verbal information diffusion, also in academia. The intuition is that some scientists who engage with a new piece of knowledge at a conference, are among the first to learn about its existence and quality. They then inform their colleagues about it, who then subsequently inform their colleagues, and so on.
We equate the piece of knowledge with an unpublished manuscript, a paper. In our research setting, we just needed an originating source, a seeder. For a researcher to be a seeding node from which information about the existence and quality of the paper can spread to others in the network, they must first familiarise themselves with the paper. We thus focus on discussants who are like co-presenters of a paper on specific academic conferences, except that they are not authors.
Then we assume discussants start a diffusion process. Along this chain of information cascade about the paper, some researchers hear about it. These may, for instance, decide to cite the paper. They may, when they happen to review the manuscript during the subsequent peer-review process, be more familiar with it, which might increase the chances of publication. Both of these outcomes are measurable (number of citations, and the quality of the journal the paper gets published in), and both matter to academics.
We tested the relationship between a discussant’s ability to diffuse information about this paper (i.e., how neighbourhood-central they are) and the annual citation count. We do this in two different academic networks. We tested a network of formal collaboration, where we link authors when they have co-authored a paper together. The other network is a network of informal collaboration, where we link researchers when one acknowledges the other. The contribution of discussants to diffusion of information about the paper is statistically insignificant in both cases. Interestingly, in the formal collaboration networks (where we link researchers when they co-author a paper), the effect is largest at values of between 0.15 and 0.25. This indicates a rather high loss of information or vice-versa a low propensity with which nodes share information.
Application to social media
The neighborhood centrality can be used for more, though. Suppose you are concerned about the spread of fake news on social media platforms. For instance, a doctored video goes viral. How could you limit the spread of fake news?
One possible approach might be to target specific individuals only, namely, those whose position in the network greatly influences the depth of the diffusion process. The question thus becomes: “what is a node’s potential to diffuse information across the network?”
Also here, existing centrality measures fail to capture the fundamental properties of the diffusion process on social media platforms. There information diffuses fundamentally differently. Firstly, information evolves rapidly, and people move on quickly to share new topics and pieces of information. Secondly, the likelihood with which information is reshared (i.e., passed-on to network neighbors) depends on the nature of information, as some information may be more exciting to share, possibly due to its novelty or what it represents. For example, a study published on Science finds that on Twitter, false news stories are 70 percent more likely to be retweeted than true stories.
Neighbourhood centrality captures these properties. Firstly, parameter , which in this case is the probability that a participant shares information with a neighbouring node, is not fixed, and depends on the nature of information being shared (i.e., whether it is fake news, rumors or true stories). Secondly, neighbourhood centrality does not include repeated exchange of a piece of information between pairs of neighbouring nodes, making it a suitable measure of node importance in settings where information evolves rapidly. Finally, neighbourhood centrality considers not only direct neighbours but also neighbours of neighbours, neighbours of neighbour’s neighbours, and so on, and hence, captures a node’s potential to diffuse information across the network!
In this article, we discuss several ways to quantify the importance of nodes in a network. We will discuss how a simple game can help study this special property, and how it can help us in cases like reducing fake news.
One of the main building blocks of modern AI-tools are artificial neural networks, abstract models inspired by the structure and functions of biological neural networks which enable machines to "learn". In this article, I will discuss some thoughts on this topic.
In this article, dear reader, I am going to show you in which way the development of your opinion during the last political issue, the spread of a virus among your acquaintances during the current pandemic, and the alignment of some particles lying inside the device from which you are reading this article are extremely comparable phenomena.
We want our guts to be filled with a diverse range of mutually beneficial and competitive interactions, a perfect blend of friends, frenemies, and enemies to keep our guts active and body on its toes. Read how networks can help understand these interactions!
An echo chamber is a community wherein the same opinions are bounced around, endlessly ‘echoing’ with barely any change. And as they do, any other opinion is shunned, pushed aside, and eventually just rejected without consideration.
 , which can be interpreted as an information decay parameter in word-of-mouth diffusion processes, and as a probability of information passage in diffusion processes that do not involve face-to-face dialogues (e.g., diffusion in social media platforms). Like in Chinese whispers, a person does not fully understand the issue, or something is lost. That’s what we capture with 𝛿. Alternatively, information decay can be a result of topical distance to the first sender.
  be the number of
  -th order neighbours of node
  . That is,
  consists of all direct neighbours of
  are all neighbours of
  , of node
  for nodes at distance
  from
from  is the extent to which the quality of information has decayed by the time it reaches a node at distance
  , all nodes have identical neighbourhood centrality because regardless of where information seeds from, it will eventually spread to all nodes.
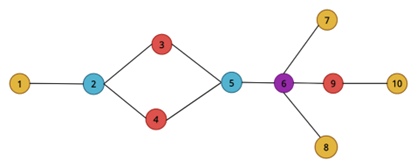
 0.1
0.1 0.3
0.3 , the ordering of neighbourhood centrality correlates with the ordering of degree centrality. But as
  , but for
  , node 3 ranks higher than node 2. Similarly, when