Think about the last time you streamed a video on your phone or sent a WhatsApp message over the internet. These seemingly easy actions are part of our daily life, and we consider it natural that we are always connected to the internet via a cellular network. But what happens if the network breaks down? And how can we prevent these networks from breaking down? To answer those questions, we first have to understand how the cellular network works and how we can model it.
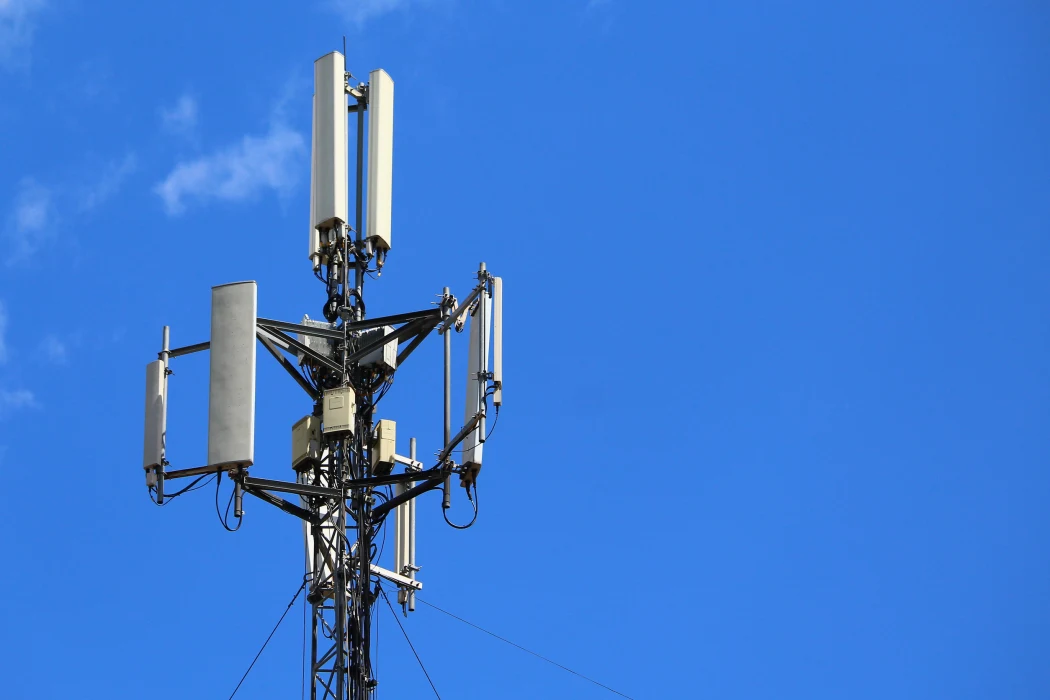
Suppose you have a phone with a telecom subscription. Then, when you are not connected to a Wi-Fi network, you will probably be connected to a base station (See the cover photo above). These base stations are scattered all over the earth on cell towers with often multiple antenna’s. Via these base stations, your phone obtains access to the internet.
Wireless networks went through some generations: we started with the first generation cellular network in the 80s with only options to make phone calls - not even send messages! Currently, we have arrived at the fifth generation networks (5G), with many applications over the internet: from autonomous driving to augmented reality to connected smart homes.
The plethora of possibilities and the reliance on mobile networks, however, also increases the impact of failure and disasters. Unfortunately, there have been many examples of such disruptions: a US-wide network outage in February 2024, an outage of 200 base stations in Taiwan after an earthquake in April 2024, two hurricanes in Puerto Rico resulting in a power outage and consequently cellular outages lasting over three months, or an hour-long disruption of the emergency network in the Netherlands in 2019.
Therefore, measuring the resilience of the cellular network is of utmost importance – how well does the network withstand failures? And, if the resilience is low, how can we improve this resilience? In this article, we show how we analyzed the cellular network in the Netherlands, and come up with a solution on how to improve the network.
Model
To measure the resilience of a network, we calculate the service quality of a user, which is comprised of two parts:
the experienced throughput, i.e. the speed of your internet connection, and
the outage probability, meaning the probability that you still have a connection.
We define the throughput (also called channel capacity) between user and base station in terms of the available resources of base station (bandwidth divided by degree ), and the quality of the signal (signal-to-noise-ratio, SNR):
This signal-to-noise-ratio is an important term in the equation: suppose you are in a very crowded bar with a lot of background noise. Then, it is very difficult to hear your friend who is talking to you. But when you are in a very quiet place and your friend is talking as loud as in the bar, it feels like they are screaming! In this first scenario, the SNR is low, as there is a lot of background noise compared to the power of the signal, while in this second scenario the SNR is much higher. There is one catch: when the noise is too much, or your friend is too far away to understand, the SNR is just too low. If that happens in the cellular network, you will experience an outage, which means you will be disconnected.
A resilient network is a network where the service quality (so the throughput and outage probability) has only little to no decrease after failures in the network.
Cellular networks in the Netherlands
Mobile network operators are obligated to register their base stations on www.antenneregister.nl. Therefore we have access to data of all base stations in the Netherlands! With this data set, we made a simulation of the mobile networks in the Netherlands. As we did not know the exact mobile traffic in the Netherlands, we estimated the mobile traffic based on population data. Statistics Netherlands (Centraal Bureau voor de Statistiek) every year publishes the number of habitants per zip code, municipality, and even 100x100 m square in the Netherlands.
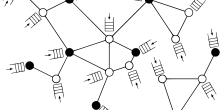
In the Netherlands, there are three main mobile network operators (MNOs). They each have their own base stations and hence their own network, as shown in Figure 2. If you are subscribed to one of these operators (or an operator using the network of one of these three MNOs), you can only connect to the base stations of your own operator.
Figure 2: Base stations in the Netherlands per mobile network operator (MNO). The regions show the 12 provinces of the Netherlands.
We simulate users in the Netherlands as points and split the users over the three MNOs. Areas in which more people live, get more points. Precisely, we distribute the points according to the respective population density of that area (see Figure 3). Then, we connected each user to a base stations, based on whether it could provide a good signal quality and whether it was not yet connected to many users. This algorithm worked as follows:
Pick a user from all simulated users (that are not yet connected) at random.
For each base station :
Calculate from user to base station .
Find the degree of this base station, meaning the number of users that are already connected.
If the is high enough, connect user to the base station for which is the highest.
Repeat this algorithm until we have connected all users (if possible).
Remember, to calculate the throughput of a user, we have to divide the available resources of a base station over all users that are connected to that base station. Thus, although it is nice to connect to the base station that gives the highest signal, we also have to take into account the degree of the base station. We do this by dividing by the degree . Then we connect to the base station for which this value is the highest. This way, base stations that have excellent signal but already serve many users are less 'attractive,' and the algorithm may choose a base station with medium signal but very few connected users instead.
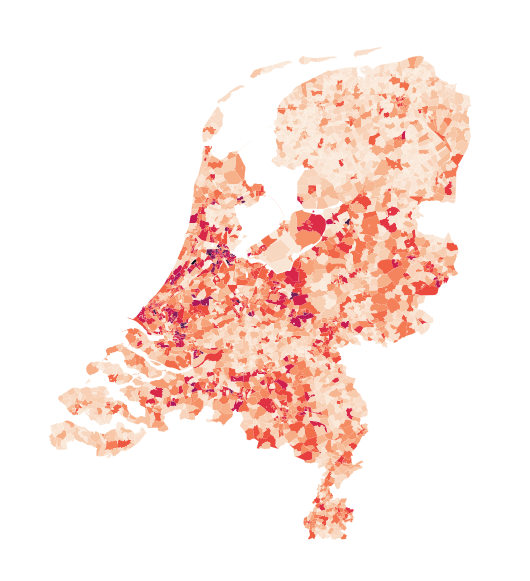
Figure 3: Population density in the Netherlands. Dark areas represent highly populated locations
Then we ask every user two questions:
Are you disconnected? This could happen if the signal quality is too low, maybe because the user is too far away from a base station.
Are you satisfied? Every user requires a certain throughput. For instance, sending a WhatsApp message uses less data than watching a YouTube video, so if you are watching YouTube you will need a speedier connection than when you're texting. Maybe the base station cannot provide you with enough throughput to satisfy your requirement.
National roaming
We analyzed this model for all three operators. Next to that, we analyzed a scenario in which all operators work together, meaning subscribers of any MNO can use any base station. We call this national roaming. We were particularly interested in whether national roaming would lead to a better performance of the network... and it does!
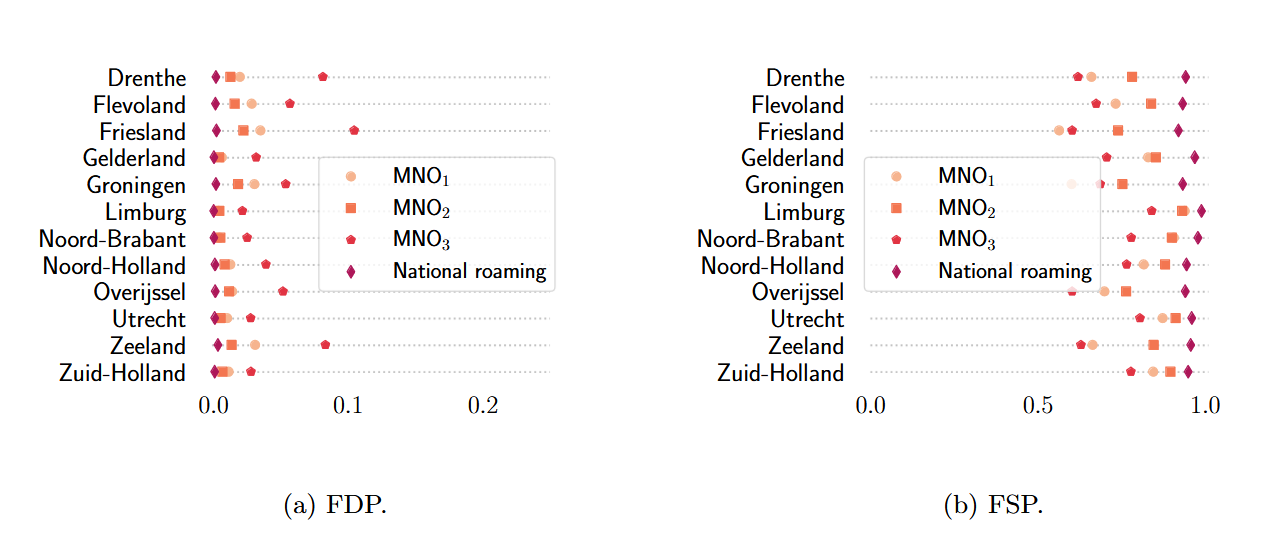
Figure 4 shows that national roaming will always outperform the scenario in which users can only connect to base stations of their own network: for national roaming, the fraction of disconnected population (FDP) is lower, and the fraction of satisfied population (FSP) is higher compared to all operators separately.
Figure 4: Fraction of disconnected and satisfied population for the three MNOs and under national roaming in different provinces
We also looked into some ‘light’ versions of national roaming, where operators only share in areas where the coverage is too low, or only share the 3G network and not the 4G and 5G networks. Although this will give less benefits, such methods still outperform the situation as it is now. These methods are already being used in other countries. For example in India, where operators work together in certain parts of the country because the infrastructure is more scarce. In the US, they introduced roaming under disasters, where operators share their network in case of (natural) disasters or emergencies. After the war started in Ukraine, operators implemented national roaming to make sure people could stay connected.
Concluding, all forms national roaming would give every consumer a faster and more reliable internet connection. Next to that, we also showed that by sharing the networks, we can reduce the number of base stations that we need to have in the Netherlands. Thus, next to improved service quality, it will also reduce power consumption.
You might ask: why isn’t this implemented yet? Well, mobile network operators still have economic concerns: if the network of all operators is as good as the others – why would a consumer subscribe to one network instead of to another?
For both sustainability and our internet quality, national roaming would be better. Now we only have to find a (business) reason for the operators to implement this! 😊
We might not be fully aware of it, but we all use wireless communication everyday in many familiar situations, such as when we connect our laptop to the local Wi-Fi network, when we use navigation apps to orientate ourselves while driving, or when we send a message to a friend using our smartphones. It has become so natural for the world we live in, that we often take it for granted and have no idea of how it works.
One of the main building blocks of modern AI-tools are artificial neural networks, abstract models inspired by the structure and functions of biological neural networks which enable machines to "learn". In this article, I will discuss some thoughts on this topic.
One of the lessons learned after the financial crisis of 2008, with Lehman Brothers collapsing, causing instability in the global economy, was that there is a strong need to better model the underlying financial network in an economy as a whole.
With ever-growing possibilities and interconnectivity on the internet, we rely more and more on it being secure. However, our classical internet is not provably secure, could a quantum internet solve our problems?
 between user
  and base station
  in terms of the available resources of base station
  divided by degree
  ), and the quality of the signal (signal-to-noise-ratio, SNR):
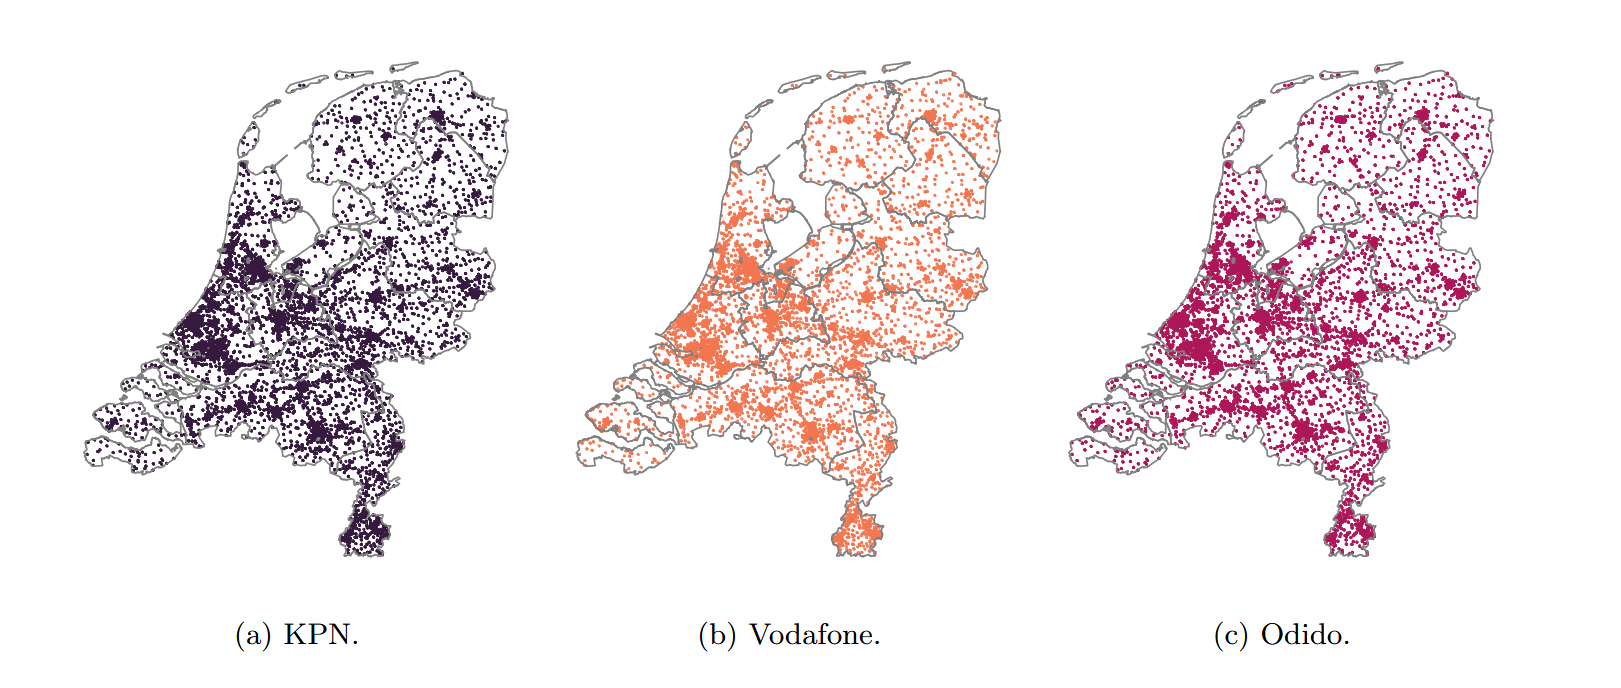
 from user
  is high enough, connect user
  is the highest.