2020 - 2022 was a strange period. Covid-19 was rampaging through human society like a forest fire. For a while, we were helpless and forced to shut ourselves into our own homes. Overall, it was a tough phase for humanity. But soon, the online revolution took place.
Education and work shifted online. One positive change brought about by the lockdown that we enjoy to this day is the rise in the online delivery sector. Even though the world has opened up again, we have embraced online delivery, and at the moment, it looks like it’s made to stay for the years to come. Go down the memory lane, and compare for yourself - how frequently did you order groceries/food online before and after the Covid-19 lockdown?
Suppose you are returning home from a long day at work, and looking forward to the weekend. If you are an introvert, then on a Friday night, one might argue that there are only a handful of things more fun than eating a pizza while playing video games or binge-watching your favourite TV series. There are several pizza shops in your city, two of your usual go-to ones being ‘Papa Tom’s’ and ‘Pizza Shed’, with a preference for the former. You therefore login to your ’Papa Tom’s account and build a custom pizza with your favourite toppings (pineapple is not on the menu!). When checking out, you are provided an estimated waiting time of 55 minutes before delivery. No way! Why does it have to take so long? You are starving, and need the pizza asap, and you cannot wait even a second longer than your patience threshold of 30 minutes. Since 55 minutes is way too long to bear, you logout from ‘Papa Tom’s’ and login to the Pizza Shed website, and re-build your customer order. This time, you are notified an expected waiting time of 25 minutes, which you gladly accept.
Why was the expected waiting time at Papa Tom’s (55 minutes) so high? Probably because there were not enough chefs and/or delivery agents to expedite the service. As a result, they lost a potential customer in you. But what is important is that they never realized that you were a potential customer. You had to look for other alternatives, due to their unreasonable waiting time. Let us think of another situation where we encounter similar experiences - you go to a hair salon and before you even enter, you see the barbers tending to one person each, along with few other customers reading magazines on the couch. You estimate that it will be your turn after a long time, so you decide to go to another hair salon. It is highly probable that not just you, but several other people decided to go to another hair salon after observing the congestion in the shop at different moments during the day. And once again, the owner of the hair salon never realized how many potential customers they were losing. In all such instances, you represent someone who brings revenue to the service provider. But due to large waiting times, you abandon, without them even realizing that you have abandoned. We call this a loss of opportunity. This leads to customer dissatisfaction; but more importantly, is it possible that service providers do not even realize a loss of opportunity?
Take a look at Figures 1 and 2. They represent 2 distinct service systems. In particular, we can assume that Figure 1 corresponds to Papa Tom’s, and Figure 2 corresponds to Pizza Shed.
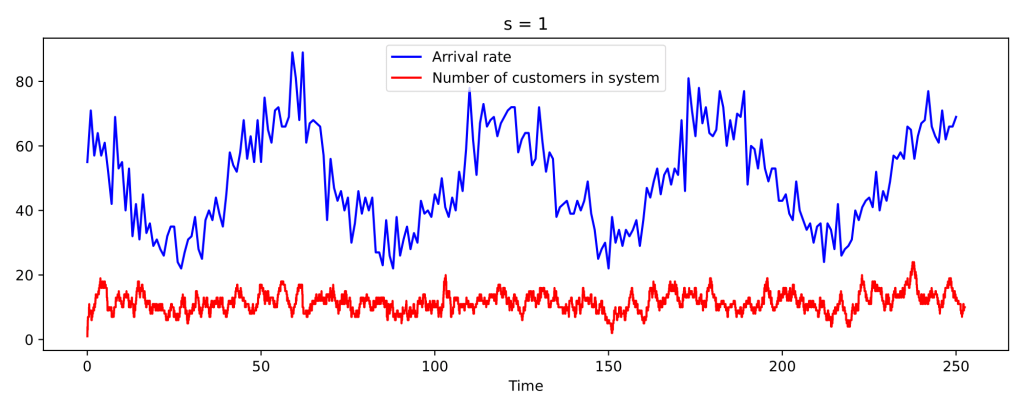
Figure 1: Papa Tom's service capacity
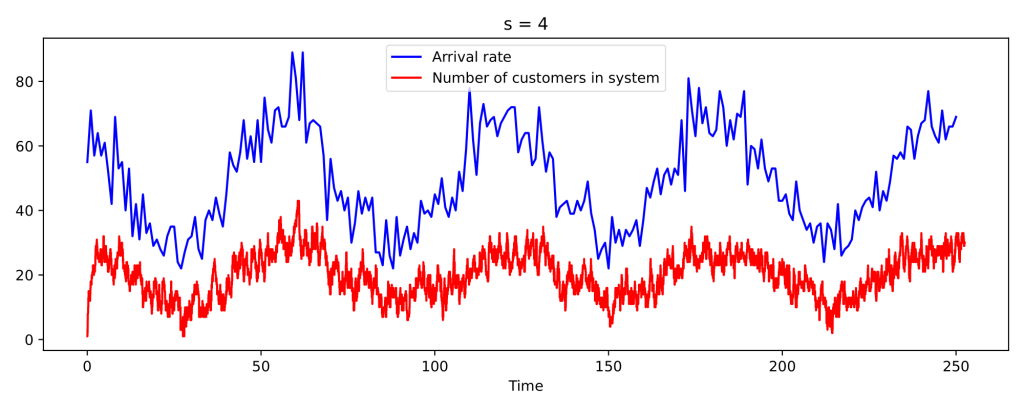
Figure 2: Pizza Shed's service capacity
The service capacity at Pizza Shed is 4 times that of the service capacity at Papa Tom’s, which essentially means that Pizza Shed processes work 4 times faster than Papa Tom’s. The blue lines represent the demand (how many customers want to receive service at any given time) which varies with time because in most practical systems, the demand fluctuates during the day. For instance, food delivery companies often find higher demands during lunch and dinner hours. The red line represents the number of customers who are actually using the service at a particular time.
Now we might wonder - why is the red line in Figure 1 so flat? Let us try to understand this phenomenon. Say it is 19:00 and a lot of people are trying to order a pizza. Since the demand is high, we expect a high waiting time. This discourages additional people after a certain point from joining. A consequence of this is that Papa Tom’s receives more or less the same number of orders at all times of the day, regardless of the demand, which can mislead the owners into believing that the demand for pizza is uniform throughout the day. Pizza Shed on the other hand with a quick service causes smaller waiting times, and therefore is able to cope up to some degree with the demand during peak hours and thereby generate a larger revenue.
We note again that the real danger lies not in the fact that Papa Tom’s is understaffed, but rather that is easily possible to remain ignorant of the actual demand during the day. Both the companies do not know the demand (the blue line). The only information that they possess is the red line, from which it is easy to assume incorrectly in Figure 1 that the demand is uniform during the day. To be able to serve more customers, Pizza Shed had to hire 3 additional servers than Papa Tom’s, and they need to be compensated as well! This means that there is a tradeoff between revenue that a company can generate, and the costs it incurs for the resources it has to keep functional. Sometimes, the resource costs exceed the additional revenue generated. This tradeoff can be studied once we know the true demand and we can then take care of the staffing.
We therefore conclude that getting an understanding of the true demand (the blue line) is crucial! It is easy to be misled if the realized demand is not analyzed well. There are numerous other real world services such as - ride sharing companies, hospitals, call centres, where similar analysis can be performed. A branch in operations research called queueing theory concerns with modelling and analyzing the performance of such systems. In this area of research, under certain mathematical assumptions such as the distribution of the interarrival times between arriving customers and their service times, the performance of service systems can be studied.
Prof. dr. ir. Hans Heesterbeek, one of the leading infectious disease epidemiologists in the Netherlands, is a busy man. Fortunately for us, Hans Heesterbeek had a gap in his schedule to yet again answer some questions, this time not asked by professional journalists, but by us, four students from the Technical University in Eindhoven.
On Friday 24th of September Professor Ton Koonen received a royal distinction “Ridder in the Orde van de Nederlandse Leeuw” during the symposium “Optical Networks – communication fabric of our society”, preceding his valedictory lecture “Light work(s)”.
How can one hope to understand the precise structure of a virus if it is able to become unrecognizable within weeks? The mathematics behind this questions didn't let go of my mind for extensive periods of time during my PhD studies in Belgium.