Terms used on network pages
Basic notions
On this page, we briefly explain some basic notions that will frequently appear on the NetworkPages. For those readers that are interested in more details, we urge you to have a look at our articles!
Many real-world phenomena can be phrased in terms of networks. For example, when studying the traffic congestion within a country, the road network describes the possible routes that cars and trucks might take, and it provides the limits on the amount of traffic that can be managed. An electricity network describes how electricity can flow. The network of friendships between people describes who could communicate with whom so as to spread news or rumors. Many parts of the critical infrastructure of our society can be described in terms of networks, and as such networks form an important topic of research. On the NetworkPages, many articles can be found explaining interesting properties and modern research on networks.
A network consists of objects with connections between them, and possibly also properties of the objects and their connections. In a road network, the objects may be the cities, while the connections are given by the roads between them. The properties of the objects could correspond to the number of cars in the cities, while the properties of the connections could correspond to the lengths of the roads, the number of lanes they consist of, the amount of traffic, etc. The objects and the connections between them are modeled as graphs, see the explanation below. For computer networks, the computers are the objects, and they are connected to one another by physical cables. Properties of the connections could be the bandwidth of the cables, the amount of information sent along them, or even the delays of packets sent on the cables.
Societal needs often require that networks are controlled and engineered so as to function as efficiently as possible. In networks, often algorithms are used for this, see the explanation. Unpredictability and variability, for example in the amount of traffic in a road network, are common features of many networks, and dealing with uncertainty by robust methods is crucial to solve many societal problems. Hence, besides the theory of algorithms also probability theory plays an important role in the study of networks.
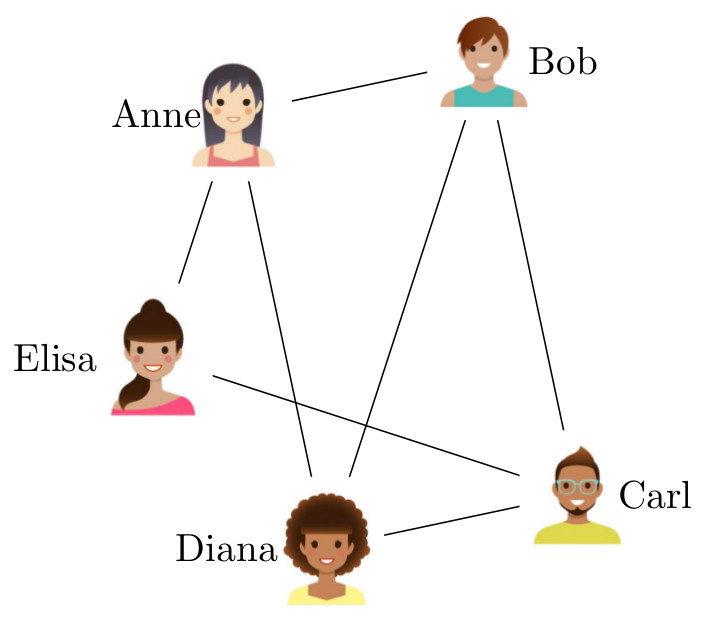
As we just explained above, a network consists of objects with connections between them. In mathematics a network is called a graph, and objects are called vertices (or nodes) and the connections are called edges. For example, when we represent the social network of a collection of people as a graph, the vertices are the people under consideration, while the edges list all the friendships between them. Thus, when Anne and Bob are two friends in the social network, the graph contains an “Anne” vertex and a “Bob” vertex with an edge between them.
In railroad networks, the vertices represent the stations and the edges the railways that link them. Of course, sometimes we are also interested in properties of the objects and the connections, but we refrain from discussing this generalization here.
Let us mention some other examples of networks. In the FaceBook friendship network, the vertices correspond to the FaceBook users and we draw an edge between FaceBook friends. In the collaboration network of the Internet Movie Database, the vertices correspond to actors, and we draw an edge between two actors when they have both played in the same movie. In an internet graph, the vertices could correspond to routers, while the edges correspond to physical cables connecting different routers. In the World-Wide Web, the vertices correspond to web pages and the edges correspond to hyperlinks between them. Sometimes, data sets allow for several representations in terms of networks. For example, in the Internet Movie Database, we could also represent the movies by the vertices and draw an edge between two movies when there is an actor acting in both movies. Different network representation might give information about different properties of data sets.

In many networks, the connections are directed and this direction is important. For example, in a road network, it is pretty important to know the direction of one-way streets!
Let us discuss some common notions from graph theory. The degree of a vertex is the number of connections it has, or, in other words, the number of edges it is in. A graph is called connected when one can move between any pair of vertices by hopping from vertices to their neighbors. The graph distance between two vertices is the minimal number of edges separating them, or the minimal number of steps a walker would need to jump from source to destination. The diameter of a connected graph is the maximal graph distance between any pair of vertices in it.
Probability theory is the part of mathematics that studies chance. This is best illustrated by games of chance. For example, when tossing a fair coin, the probability of it turning up heads is 1/2.
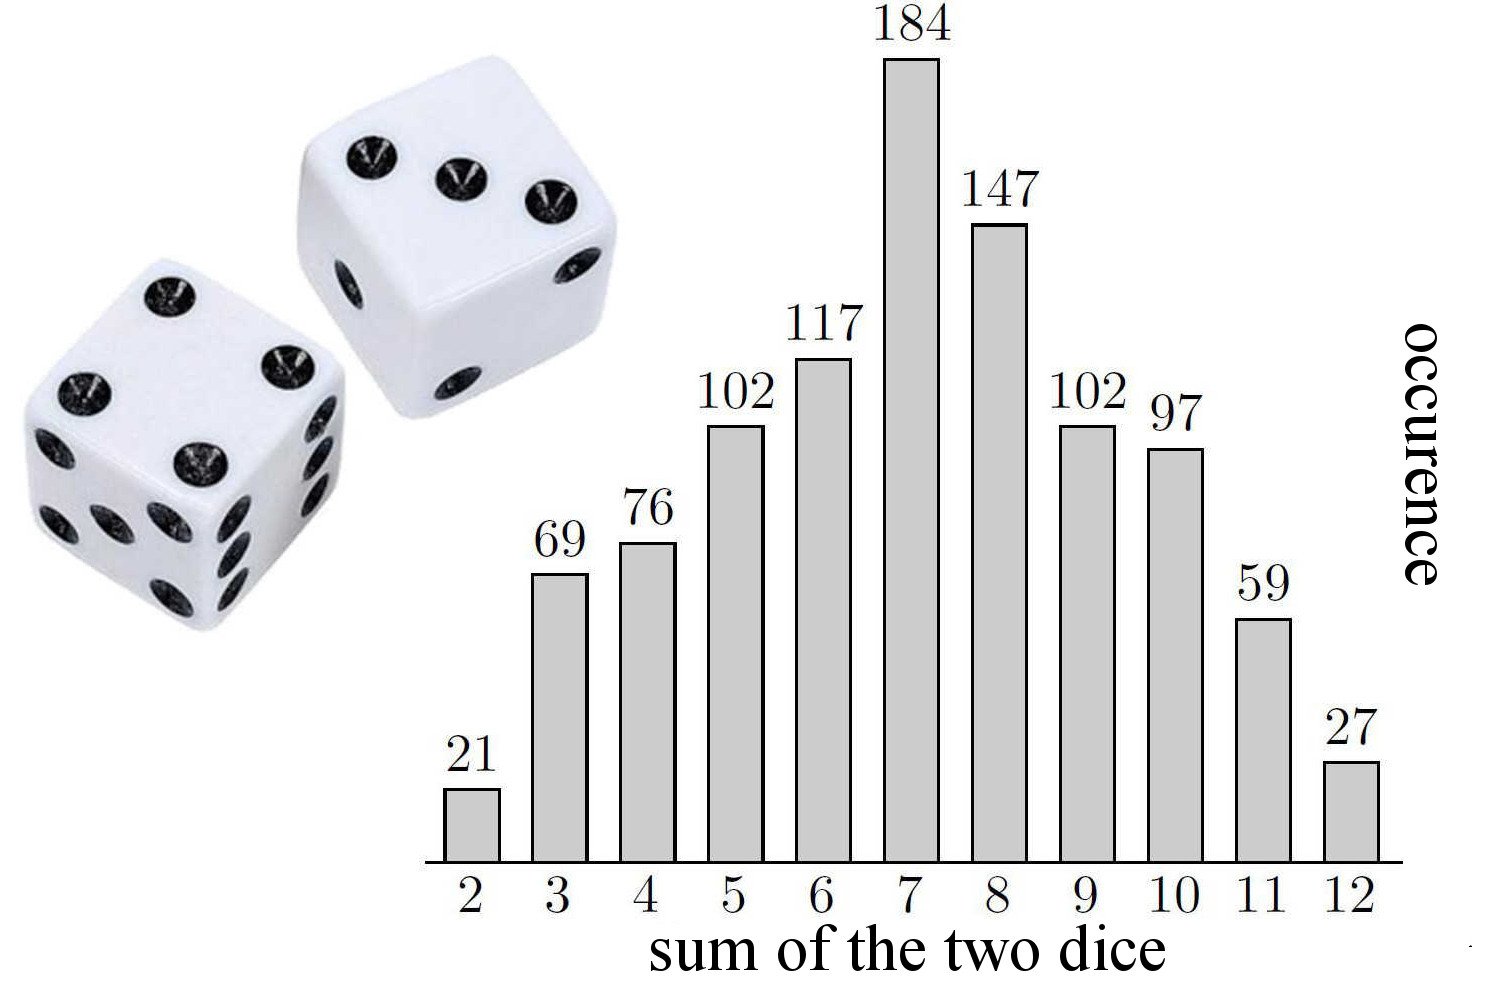
We rely on randomness in board games. In Settlers of Catan, we toss two dice to decide which and how many cards the players receive. The outcome 7 is the most likely and has a chance one out of six, the outcomes 2 and 36 are the least likely with a probability of  . Now we understand why 6 and 8 are such desirable numbers!
There are many interpretations of what a probability is, and discussions about this can become quite philosophical. We will not dwell on these philosophical aspects. The simplest interpretation of the probability of an event is in terms of repeating an experiment many times, in such a way that different experiments do not influence one another. Then, the probability of a certain event corresponds to the proportion of times that the event occurs in many of such independent experiments.
Mobile phones, ATMs, modern cars, televisions, e-readers: none of them would work without software. The heart of software is formed by algorithms: step-by-step procedures to perform given tasks. Algorithms can be executed by computers, but also by persons.
For instance, suppose you hold twenty cards in your hand, each with a different number on them. Your task is to create a stack containing the cards in sorted order, with the lowest numbered card at the bottom and the highest numbered card on top of the stack. A simple algorithm for this task is the following. Go over the cards in your hand one by one, to find the lowest numbered card. Put this card as the bottom card on the stack. Then go over the remaining cards in your hand, to find the next lowest-numbered card, and put it on top of the previously selected card. Repeat this procedure until all cards are on the stack.
In order for an algorithm to be executed by a computer it has to be implemented in computer code, typically in a computer language like Java or C++. When the description of the algorithm is sufficiently precise, implementing it is not very difficult for a skilled programmer. Thus, when you want a certain task to be performed by computer the challenge lies in coming up with a good algorithm.
<!–
Often there are different strategies to perform a given task – or “to solve a given problem”, as it is usually called – leading to different algorithms. These algorithms typically differ in efficiency: some are fast while others are slow. Of course the actual time a computer needs to solve a problem depends on the speed of the computer.
Moreover, it depends on the size of the problem at hand: sorting a thousand numbers will take less time than sorting a million numbers. It is nevertheless possible to compare the efficiency of algorithms in a mathematical way. To this end the number of “steps” of the algorithm is analyzed as a function of the number of input elements.
For instance, consider the algorithm described in Basic Notions – Algorithms for creating a sorted stack of cards. Suppose the input consists of  cards. To find the smallest numbered card we look at all cards, to find the next smallest card we look at the remaining
  cards, and so on. Thus in total we perform
\begin{equation*}n+(n-1)+\ldots+1=n(n+1)/2 \text{ steps.} \end{equation*}
The exact number depends on what we consider to be a “step”, but the important fact is that the number of steps grows quadratically in the number of cards to be sorted. In technical terms: the running time of the algorithm is  . If the running time of an algorithm grows quadratically, it will take four times as long when the input doubles in size. An algorithm whose running time grows linearly – we write: the running time is
  – would only take twice as long when the input size doubles. Thus linear-time algorithms are much faster than quadratic-time algorithms for large inputs.
An important distinction between algorithms is whether their running time grows polynomially in the input size such as  or
or  , or exponentially such as
  or
or  . The running time of the latter type of algorithms grows so quickly that they are basically useless, unless the input size is very small. Suppose, for instance, that we have an algorithm that performs steps on an input of size , and that we have a computer that can do 1 billion steps per second. Then the algorithm would take only roughly 1 second on an input of size 30. However, on an input of size 50 it would already take over 13 days, and on an input of size 60 it would take 36 years… Buying a faster computer is not going to help you much. What you should try instead is to come up with a more efficient algorithm. Trying to find the most efficient algorithm for various computational problems is a lively and important branch of theoretical computer science.
Random graphs are graphs that are produced using probabilistic rules. For example, the edges that are present or the number of vertices that are part of the graph are determined by performing a chance experiment. The idea behind this can be that people meet each other in an unpredictable way, and thus the precise connections that exist could be seen as the outcome of a chance experiment.
On the Network Pages, we describe several random graph models that have been used to model real-world networks, such as the Erdös-Rényi random graph, the configuration model, and preferential attachment models.