Sometimes, it is enough to know that something needs to be above average to unlock challenging mathematical problems.
Average and above average students
Imagine a group of students, who just received points on an exam. Besides knowing a little bit about the grading scheme – only full points are awarded – the only information we have is that the average result was 13.6 points, but we don't know anything about the number of the students, their individual performances or the maximum number of possible points for the exam. What conclusions can we draw from this information? For example, could we conclude that there must have been a student that did particularly well?
Of course, the answer depends on what we mean by "doing well", yet we can still infer a little bit about this: At least one student must have scored 14 points or better – otherwise, everyone would have received at most 13 points, and the average score would have been at most 13 points, too.
Something interesting happened here: Usually, if I wanted to convince you that at least one student did well in the exam, then exhibiting for example the best student would suffice (assuming we ignore any concerns about the confidentiality of examination results...). But this is not what we did! Instead, we managed to show that there is a good student – at least, a student who exceeds the average performance of their peers – without needing to find them.
From averages to expected values
In fact, this observation works with any data set: There is always at least one data point that is at least equal to the average taken over the entire data set. Intuitively, this makes a lot of sense: The average should be somewhere in the middle of all the data, so there should at least be one value above it.
We want to think about this in more probabilistic terms to obtain a useful mathematical tool. The data will then be the outcome of a random experiment, written as some random variable . The weighted average over all possible outcomes – weighted according to the probability of the outcome – is the expected value . In this language, our observation takes on the following form:
There is always an outcome to a random variable that is at least equal to its expected value .
Just as the example in the beginning, about the exam results of the students, this statement guarantees the existence of something that is above average, without actually exhibiting it. In the case of the student group, that might seem like a drawback. But if we want to make mathematical statements, this might even be an advantage! In fact, the statement above is one version of the so-called probabilistic method, which generally states that if a randomly chosen object has a desirable property with positive probability, then there exists an object having the desirably property.
The probabilistic method was pioneered by the Hungarian mathematician Paul Erdős (1913 - 1996), famous for his many contributions to combinatorics and graph theory, and it has since become an important tool in these areas of mathematics.
If a randomly chosen object has a desirable property with positive probability, then there exists an object having the desirably property.
The probabilistic method
Ramsey theory
One of Erdős' earlier applications of the probabilistic method was to a problem in Ramsey theory, an area of mathematics that, roughly speaking, deals with the question of how large we need to make a certain structure to be guaranteed a given smaller structure. In more concrete terms, consider points, called vertices, and connect each pair of them by a line, called edge. The resulting object is called the complete graph on vertices, , where the attribute complete means that all possible edges are present in the graph. If you now colour every edge of a arbitrarily by either red or blue, you might notice that there is a smaller complete graph, all of whose edges share the same colour. For a given , we may ask how large we need to make to ensure the existence of a monochromatic -- the smallest such is the Ramsey number .
Let us see a concrete example, say we take . Then we ask how large we need to make to ensure the existence of a monochromatic , which is either a blue triangle or a red triangle. There is a nice mathematical argument that for every larger or equal to 6, always has a monochromatic triangle. Try this yourself, consider an at least equal to 6, draw points and start colouring all the edges either blue or red. You will soon see that you cannot avoid making a monochromatic triangle. Like in the drawing below.
On the left you see , if you colour all edges either blue or red you will always get a monochromatic triangle. Do you see the two blue triangles on the right?
You can also puzzle yourself and convince yourself that if you take less than 6 vertices, say 3, 4 or 5, then you can find colourings of the edges such that the graph doesn't have any blue nor red triangles.
Determining the values of is a notoriously difficult question, with only the values for being known ( for example, if you want to see why you can have a look at this article), so mathematicians have moved their goalposts. Rather than trying to get to the exact values, trying to understand the growth of is – slightly – more feasible, but still very difficult. Indeed, it was on this question that Erdős in 1947 employed the probabilistic method, to show that grows at least exponentially. This means that for a given , there needs to be a red-/blue-colouring of without a monochromatic , and we need to be able to choose as an exponential function of .
Rather than trying to construct a red-/blue-colouring that avoids monochromatic substructures, Erdős had the fantastic idea to instead consider a random colouring: What happens if we colour each edge blue or red with probability each, independently of one another? Since a consists of edges, all of which need to have the same colour between red and blue, the probability that fixed vertices create a monochromatic for a fixed color is . One can in turn use this to show that the expected number of monochromatic 's in a is given by
The additional two in the multiplication comes from the fact that can have either of the two colors, red or blue.
It can be shown that this expression is strictly smaller than 1 for large and . Thus, we can now use a version of the probabilistic method above (instead of looking for something above average, we want something below): The expected number of monochromatic 's is less than 1, hence there is an outcome of the random red-/blue-colouring without a monochromatic , and that is exactly what we wanted to achieve!
Covering points in a plane
Let us look at another fun application of our observation above. This one is a puzzle by Naoki Inaba, popularized in an article by mathematician and puzzle aficionado Peter Winkler.
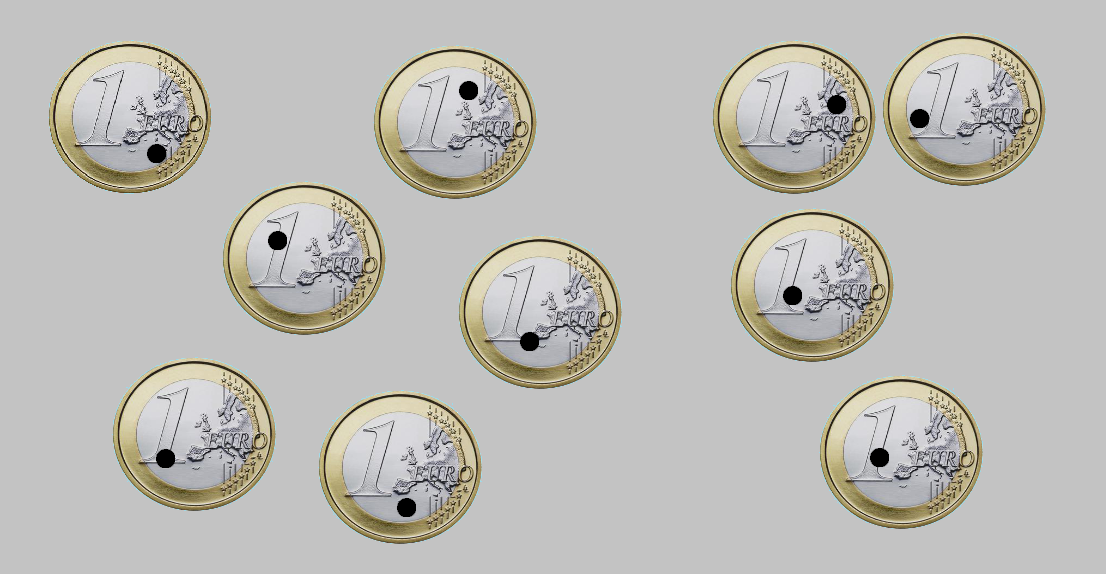
Assume we have ten dots drawn arbitrarily on a table, and we want to cover them by using 1€-coins. Is this possible? Surely yes, we can take ten coins and place one of them over each of the dots. But what if the coins are not meant to overlap? Then the question is trickier, and it seems very difficult to present a clear answer – the nonoverlapping coins leave gaps in between them and the dots might be positioned in such a way that some of them always end up in such a gap.
But again, we can make use of the probabilistic method -- only, where do we get the probability from? The dots are fixed, so we have to try to cover them at random. However, throwing coins at random onto the table would be too chaotic, and eventually the coins would overlap. Instead, here's how to do it:
Pretend the dots on the table are really points on the plane. Arrange the coins into a hexagonal pattern and extend the pattern infinitely to the entire plane. Here, it is convenient to be a mathematician and replace the coins by abstract "disks", because in practice, you may run out of coins. Then, randomly shift the coins by maintaining the orientation of the hexagonal grid. Here, it is inconvenient to be a mathematician, because this is not well-defined: For reasons rooted deep within probability theory, there is no uniform random shift across the plane. However, we can work around this by using the periodicity of the hexagonal grid -- it is enough to shift by less than one hexagon, in whatever direction.
The hexagonal arrangement of disks used for covering the points. The red arrows indicate by how much we may shift the entire configuration from a centre point.
Now that we have introduced randomness into the problem, we need to use our observation above. It turns out that the hexagonal arrangement of coins covers a proportion of , or roughly 90.69% of the plane. After applying the random shift, this means that each point is covered by a coin with a probability of approximately 90.69%. With a little bit of probability theory, it follows that the expected number of points being covered is ten times this probability, so . Since this is larger than 9, it means there must be some outcome of the random shift that covers more than nine points, and therefore all ten points.
It is now a natural question to ask whether we can also always cover 11 points? According to a paper by Aloupis, Hearn, Iwasawa and Uehara, the answer is yes. In fact, we can even do it for 12 points, but these cases require more complicated constructions -- the probabilistic method alone is not powerful enough to answer these questions. Can you see why the argument above breaks down when you have 11 points or more?
In general if you want to cover points you need to compute . What should the value of this number be to ensure you can cover all points?
On the other hand, there are configurations of 45 points that cannot be covered, and it is an open problem if it always works for any number between 13 and 45.
Nonetheless, similar to our observation about the above average student, the probabilistic method gave us a very elegant approach to two difficult questions, by completely avoiding the need to describe a specific mathematical construction. As it turned out, for both the question in Ramsey theory and the problem of covering points, having an outcome above or below the average was good enough to solve the problem!
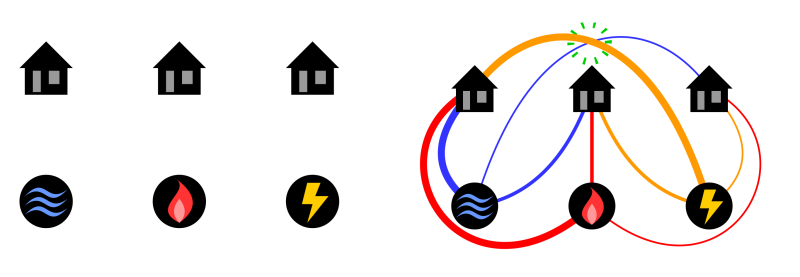
In this article Maya continues her journey from Rotterdam to Brussels. She starts thinking about a puzzle from her childhood, the three utilities problem. At the end of the jouney she has reached a very important theorem from graph theory!
During the last decades, many resources have been invested in quantum computing. This research field has grown immensely and amazing results have been obtained. The plans for the future are highly ambitious, but at the same time, there are serious questions that need to be addressed.
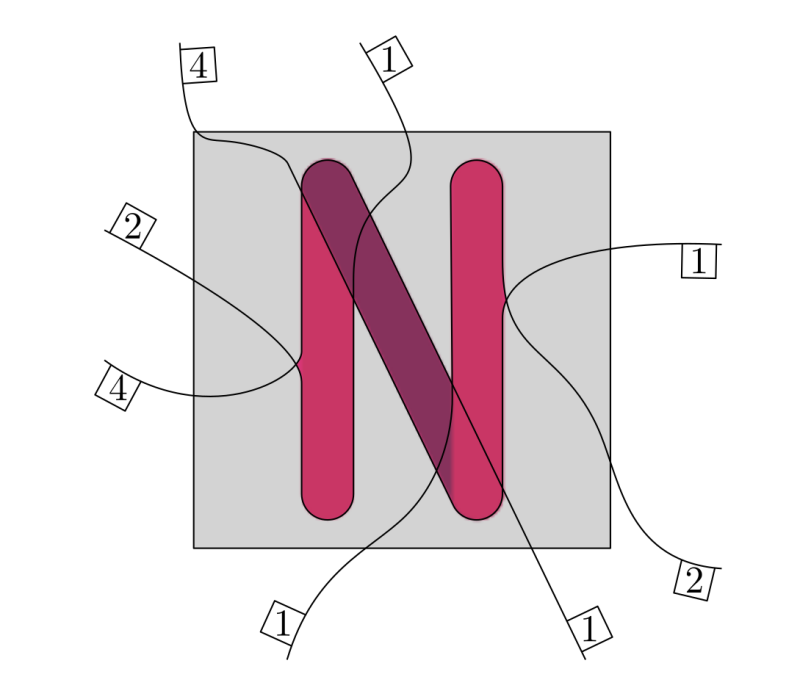
A conjecture of Erdős and Hajnal from 1989 says that forbidding any specific substructure results in existence of a very large homogeneous one! In this article you will have a look into one of the most fascinating problems in modern graph theory.
 in the middle
 of all the data, so there should at least be one value above it.
 . The weighted average over all possible outcomes – weighted according to the probability of the outcome – is the expected value
 ![\mathbb{E}[X]](https://www.networkpages.nl/wp-content/plugins/latex/cache/tex_6b4b92dccdc1aba0add8de19bc101e9c.gif) . In this language, our observation takes on the following form:
. In this language, our observation takes on the following form: points, called vertices, and connect each pair of them by a line, called edge. The resulting object is called the complete graph on
  , where the attribute
  , we may ask how large we need to make
  -- the smallest such
  .
. . Then we ask how large we need to make
  , which is either a blue triangle or a red triangle. There is a nice mathematical argument that for every
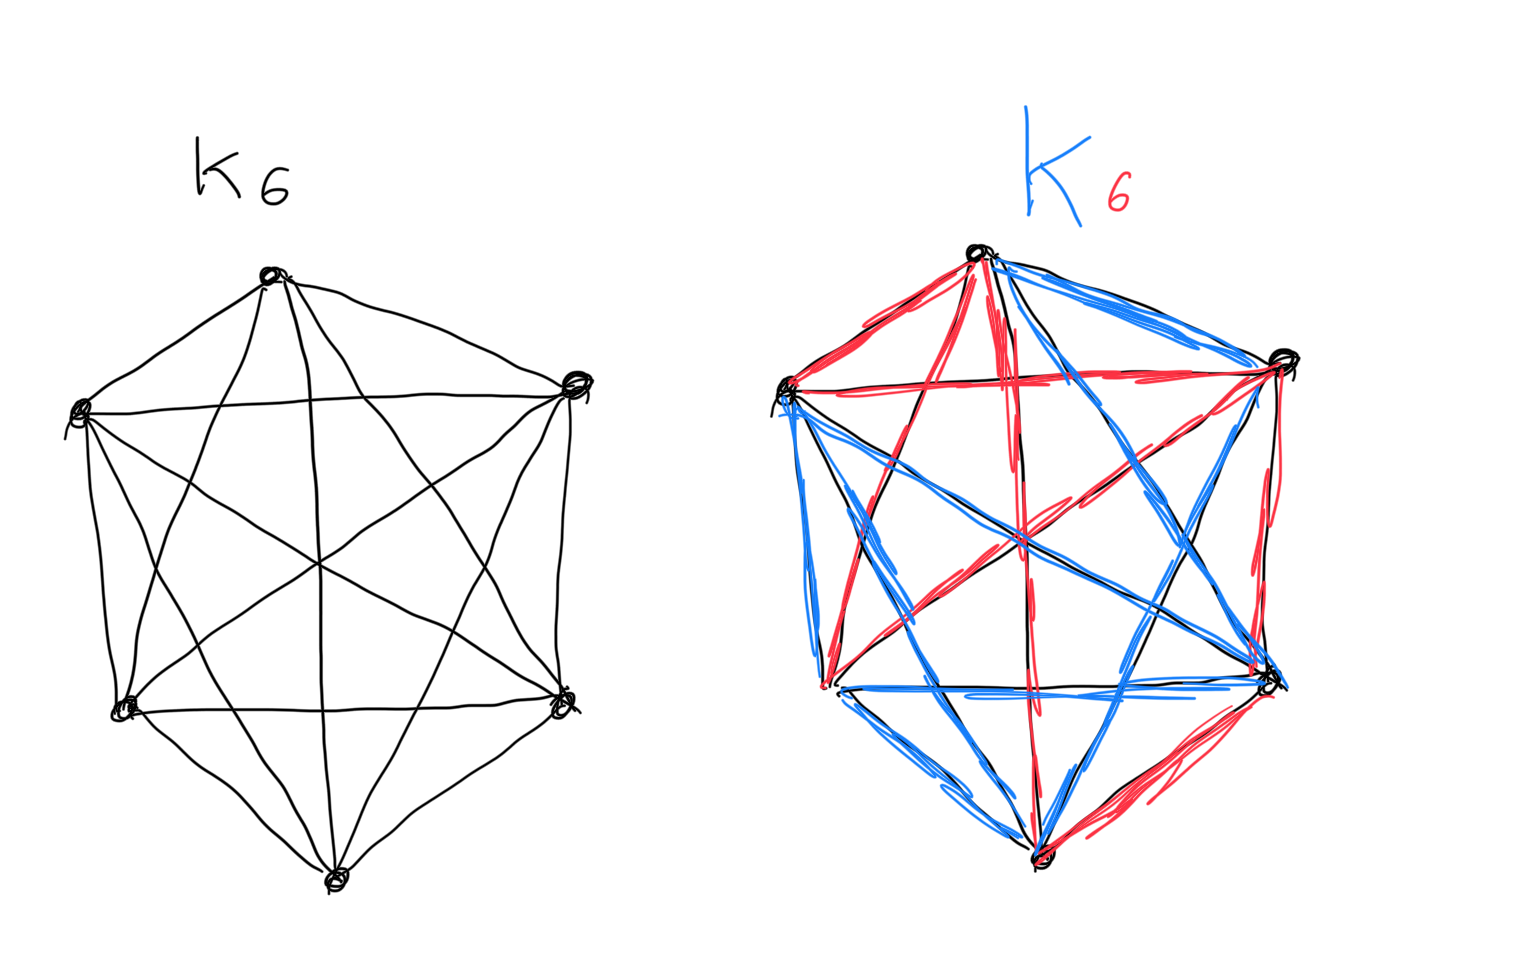
 , if you colour all edges either blue or red you will always get a monochromatic triangle. Do you see the two blue triangles on the right?
 being known (
 for example, if you want to see why you can have a look at this article), so mathematicians have moved their goalposts. Rather than trying to get to the exact values, trying to understand the growth of
  each, independently of one another? Since a
  edges, all of which need to have the same colour between red and blue, the probability that
  . One can in turn use this to show that the expected number
 ![\mathbb{E}[X] = 2\cdot \binom{n}{k} \cdot 2^{-\binom{k}{2}}.](https://www.networkpages.nl/wp-content/plugins/latex/cache/tex_d071ab9af05df8140b4dd54ac80757f2.gif)
 . Thus, we can now use a version of the probabilistic method above (instead of looking for something above average, we want something below): The expected number of monochromatic
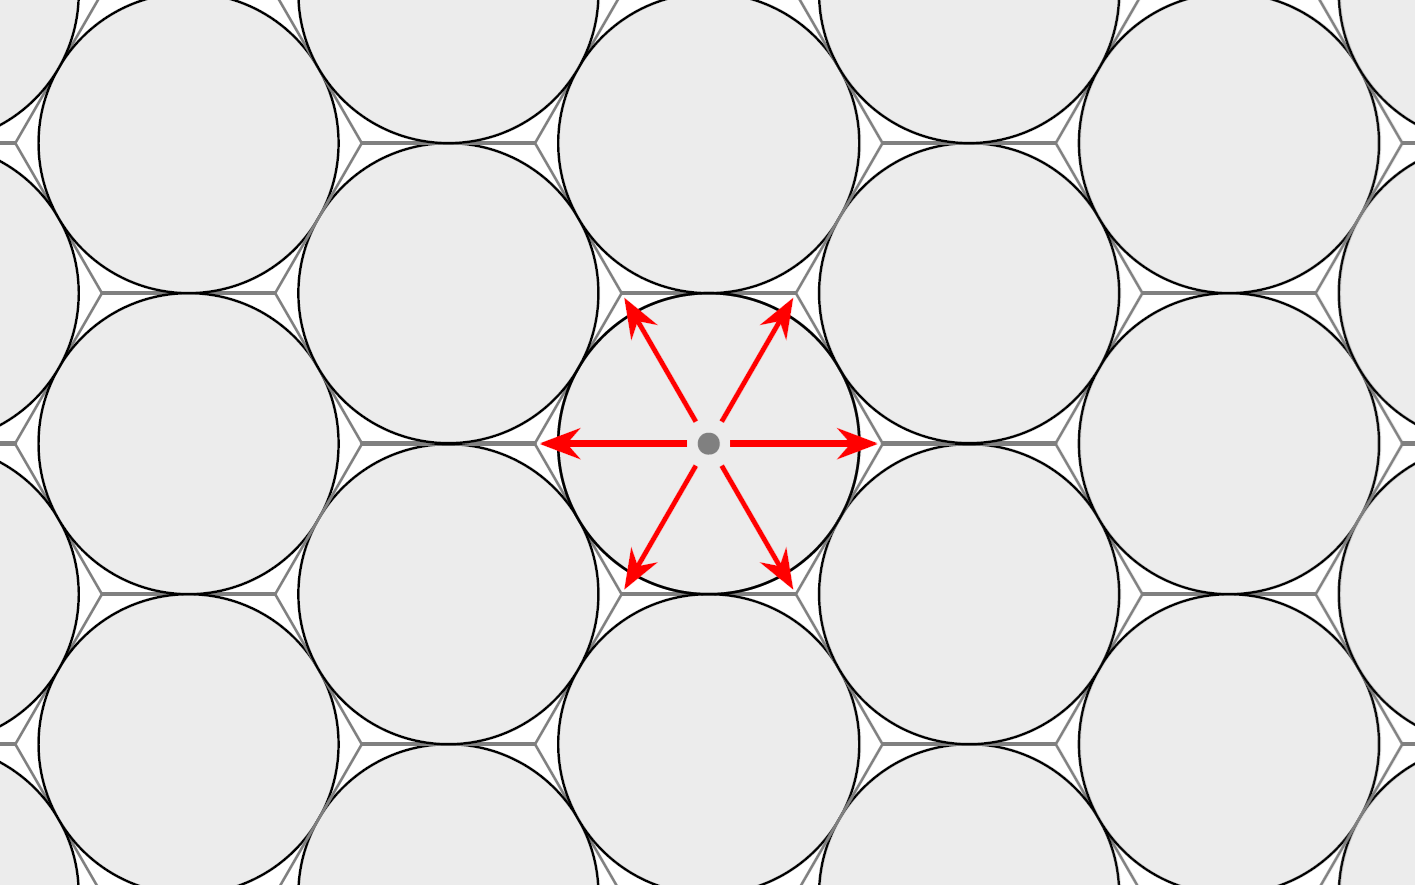
 , or roughly 90.69% of the plane. After applying the random shift, this means that each point is covered by a coin with a probability of approximately 90.69%. With a little bit of probability theory, it follows that the expected number
 ![\mathbb{E}[X]\approx 9.069](https://www.networkpages.nl/wp-content/plugins/latex/cache/tex_58986e36aa37a38fbe3bbac2c5ef3f04.gif) . Since this is larger than 9, it means there must be some outcome of the random shift that covers more than nine points, and therefore all ten points.
. Since this is larger than 9, it means there must be some outcome of the random shift that covers more than nine points, and therefore all ten points.