In the first article of this series we described how logistic chains work. We also talked about the ”just-in-time” model, and we discussed the phenomenon that small delays can have cascading effects when we schedule the whole process in an optimal way. The main idea is that the system can't absord such small delays. In this second part, we go one step further and dive in the mathematics.
The mathematics of logistics chains
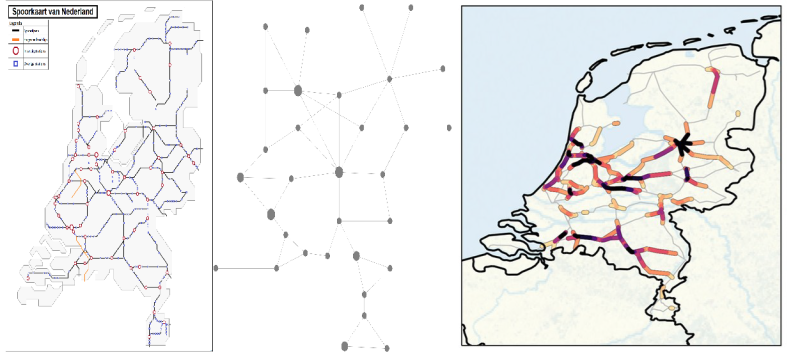
We can use mathematics and more specifically networks to study logistics chains. The network of connections, in transport, a logistics or production chain, can be visualised (Figure 2) as a directed graph in which the nodes (circles) are, for instance, the stations, and the edges (arrows) represent the (train) connections which can incur delays before or at the next station. In the left column of figure 2, the nodes have a buffer large enough to eventually absorb incoming delays, so that their outgoing arrows have no associated delay. The size and colour of each node shows how much delay it has accumulated. In the middle, the buffer is critical, resulting in delays, which occasionally accumulate into substantial cascades before dissolving again. As the critical value is approached this occurs more and more often, and the duration of such delay-cascades increases. On the right, the buffer is too small, and the average delay grows at a constant rate: it never reverts to a zero delay.


Figure 2: Stylised representation of the propagation of delays for time-buffer sizes well above critical (a), only just above critical (b), or below (c) the critical value. The colour of the nodes indicates the delay incurred at that node, which will propagate in the next time step, where red is most severe, and white is least severe (no delay propagation).
To gain a better understanding of how the sizes of buffers lead to such cascading effects we run simulations of mathematical models where we can experiment with the structure of the network and the sizes of the buffers. In figure 3 below the outcome of simulations of the delays are shown for various buffer sizes.
The most benign is when buffers are large compared to the random delays created by the source of the problem (top panel: blue line). The large buffers can absorb all delays so at any timestep problems don’t spread in the network. The argument against large buffers is that they increase the costs or lead to less profits. But as you clearly see they can reduce the stress on the system, and of the customers. The green line in that panel shows what happens when the buffer of time per node is reduced to just above the critical value, this means that the buffer size is just enough to relieve the delays. At any time step the delay built up in the network shows strong spikes of delays cascading through the network, and these can persist for many time steps. Once the buffer is reduced below the critical value, meaning the buffer sizes are smaller than the minimum size needed, the total system delay mounts up roughly linearly with time, with the slope increasing as the buffer size decreases.

Figure 3: Simulations of delays for different values of the buffer per node. Top panel, blue line: large buffers absorbing all delays so at any timestep the delay conforms to the distribution function for random seed delays. Top panel, green line: buffer size only just larger than the critical value: delays build up into substantial avalanches. Bottom panel: purple line: buffer size just below the critical value: delays cannot be compensated for and accumulate over time. Bottom panel, red line: buffer size even lower so that delays accumulate at a higher rate.
What do we learn from these simulations? When the buffer sizes are large enough there are no problems, when they are too small the system totally breaks down. But when the buffers are just above the critical size, spikes appear in the system. Eventually they are absorbed but they can create a big problem for some time. This is where you need to give some slack, and stay away from the critical value. But how far should you stay from the critical value so that you avoid these spikes and still perform well? This is the driving question in our research.
Staying away from “absolute optimality” reduces stress
Let’s zoom out a little bit, until now we have seen that in a logistics chain there is a critical buffer size where the network becomes sensitive to small delays. You definitely don’t want the buffer sizes to be smaller than this value, but you also don’t want them to be “just” larger. To keep costs and waste at a reasonable level you also don’t want buffers to be unreasonably high. This becomes a more complicated problem for companies that want to ensure that the entire chain, with many ’switches’, of their production process continues to run, especially if they do not know exactly what happens to suppliers who may be abroad. How large should the buffers be to guarantee stability of the logistics chain?
In our research, we find that you can compute how large the buffers should be to make sure that you can meet the demand but also keep the whole system safe from cascading small delays. The method and the results depend of course on the specific logistics chain at hand, but concrete computations are possible. The precise structure of the network, as well as the heterogeneity of buffer sizes, do have some influence on the critical value of the buffer and also on the shape of the distribution functions for delay cascades near criticality.
Taking the train schedules in the Netherlands as an example again, the typical time between subsequent stations is in the range of 3 to 11 minutes for Sprinters, and for Intercitys between 20 and 40 minutes, although there are substantial regional variations. If you take a close look at train departures in central stations you will notice that there is a train departure every 1 or 2 minutes. This shows how busy the train network is. However not all stations are equally busy, the train network is also highly inhomogeneous. There are stations like Utrecht and Amsterdam which are central and very busy, while other stations are less busy. The train schedules are made using advanced algorithms which provide an optimal schedule given the necessary restrictions to guarantee safety, the working schedules of employees and the availability of material. What does a buffer mean in this context: it means that rather than schedule that a train always needs to leave a station no more than a minute (or two) after it arrived, you need to allow some extra “slack” time for (all) trains at (any) station between the scheduled time of arrival and the scheduled time of the train leaving again to go to its next destination. Our research provides new mathematical methods to compute this buffer time.
In our research, we have simulated networks which are less complex than the actual train network in the Netherlands. It was the first effort to do research in this complex system, it is thus a logical choice to start with some simplified cases. These interesting results give us confidence that this line of research should be continued.
In part 3 of this series Frank Pijpers will discuss some personal experiences and ideas regarding interdisciplinary research. Stay connected!


