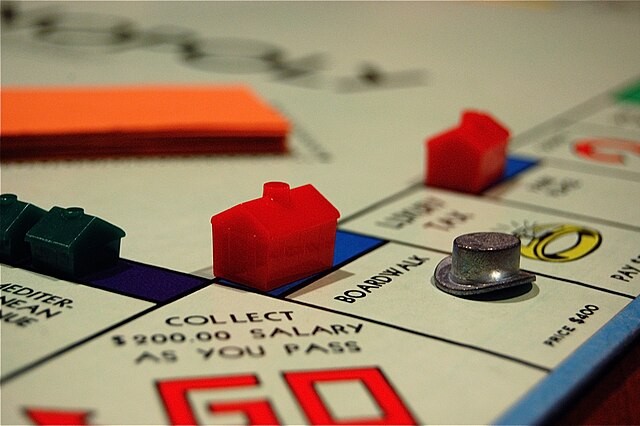
Now it’s time to tackle Monopoly! Using the tools from the analysis of Snakes and Ladders, we can now get some insights into the best properties to buy in Monopoly. Because Monopoly has lots of features not present in Snakes and Ladders, we need to think a little harder about how we want to construct the transition matrix for this game.
We will use the standard Monopoly set from the US from 2008 onwards.
For example, in Monopoly we throw with two dice, not just one! This means that the probability distribution for each turn won’t be uniform anymore. The probability of throwing 2 is , by throwing two 1’s. The probability of throwing a 7 is much higher, , since we can throw 7 in six different ways. Can you list all possible ways to do this?
Now let’s construct the well desired matrix . There are a total of 40 spaces on a Monopoly board, and we treat the Jail and Just Visiting space as the same one. Let’s first construct the first row of .
This row corresponds with the probability distribution when starting on the Go. A first attempt could be the following:
Chance and Community Chest
But here we neglect to include an important feature in Monopoly: the Chance and Community Chest cards. Usually the cards order you to pay a small fee, or maybe receive a prize, but sometimes it tells you to move to another space. We have to take this into account when constructing .
There are many editions of Monopoly, but we will use the standard Monopoly set from the US from 2008 onwards. In that set, there are nine Chance cards that advance you to another square. This can be anything from Advance to Go (Collect $200) to Go Back 3 Spaces. There are only two Community Chest cards which move you to another space: Advance to Go (Collect $200) and Go directly to jail, do not pass Go, do not collect $200. There are a total of 16 Chance cards, and also a total of 16 Community Chest cards.
How does this affect the first row of our matrix? Square 2 is a Community Chest square and Square 7 is a Chance square. These are the only squares we can reach from the Go square where we have to pull a card.
Let’s tackle the Community Chest first. How big is the probability that we end up there, if we’re starting from Go? Well, first we have a probability of throwing 2 and actually landing on the Community Chest. Then we grab a random card from the pile. What happens next? Either we get a card from the pile instructing us where to go next, or it’s telling us to pay something, and stay put. There is a chance that the card tells us to stay put, a chance that you have to go to Jail and a chance that you have to advance to Go. As an exercise, verify these probabilities on your own (you can use this list with all the Community Chest and Chance cards).
What does this mean for our matrix? We have just seen that the probability of landing on Community Chest and then staying there is . Then we also have a chance that we end up in Jail and a chance that we get back on Go again. Notice that there was already a chance of that we end up on the Jail square (by just visiting), so the total probability of ending up on the Jail square becomes In the matrix this looks like this:
You might have noticed we are ignoring an exciting rule in Monopoly. Throwing doubles! If you throw double, you are allowed to throw again, but if you throw double three times in a row, you have to go to jail. We can actually model this in the Markov chain by having three possible states for every square, resulting in a matrix. We won’t explore this version of the Markov chain, but you can try to write it down yourself!
After calculating all the other rows of the transition matrix, we can construct the transition matrix . This quite some work, but behind all beautiful and interesting things there is always a lot of work and effort. "There is no royal road to geometry", as Euclid said when asked if there is an easier way to master geometry than reading the Elements. This article is just the very final result of all this work, so don't be deterred by how much work it is to set up such matrices, once you have them you can do many nice and interesting computations with them. Let's do some computations!
One piece of information that is useful to know is what squares have the highest probability of being visited, not just after one throw, but throughout the entire game. Let’s look at the probability of landing on Go. We know that the probability of starting at Go and ending up on Go is . We can add to this the probability of going from Mediterranean Avenue to Go. But we also need to add the probability of going from Community Chest to Go. In other words, we need to add all probabilities of going from any square to Go, which is the same as adding up all probabilities in in the column under Go. We can plot this in a bar chart, so we can interpret these probabilities a bit easier:
The probability to land on the In Jail/Just Visiting square is huge! This is not really surprising though, since you never end a turn on the Go To Jail square, so it is essentially two squares in one. Let's not bother too much about this. Look at Illinois Avenue! It is the most visited property on the Monopoly board. Surely that means that it’s the best property to buy, right? We will see if that’s the case in just a moment, but let’s first look at the rest of the graph.
We also see that the expensive Park Place has a relatively low probability of being visited, about the same as Mediterranean Avenue and Baltic Avenue. So which one should we have our eyes on? We need a way to factor in money!
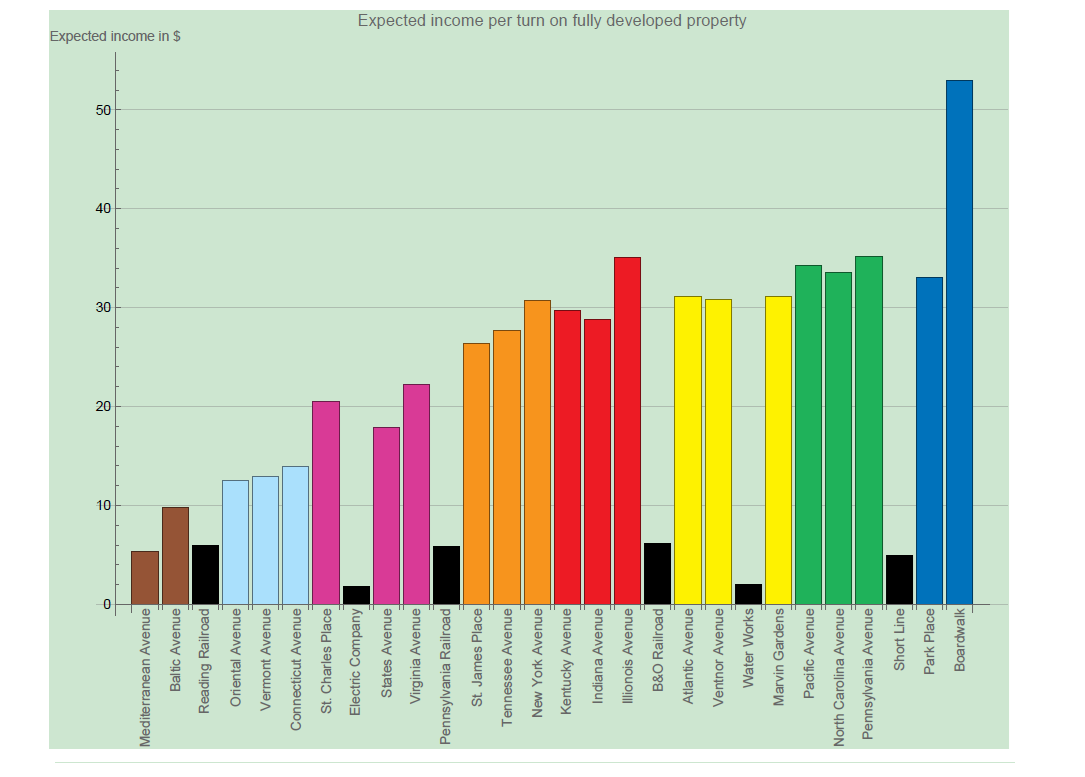
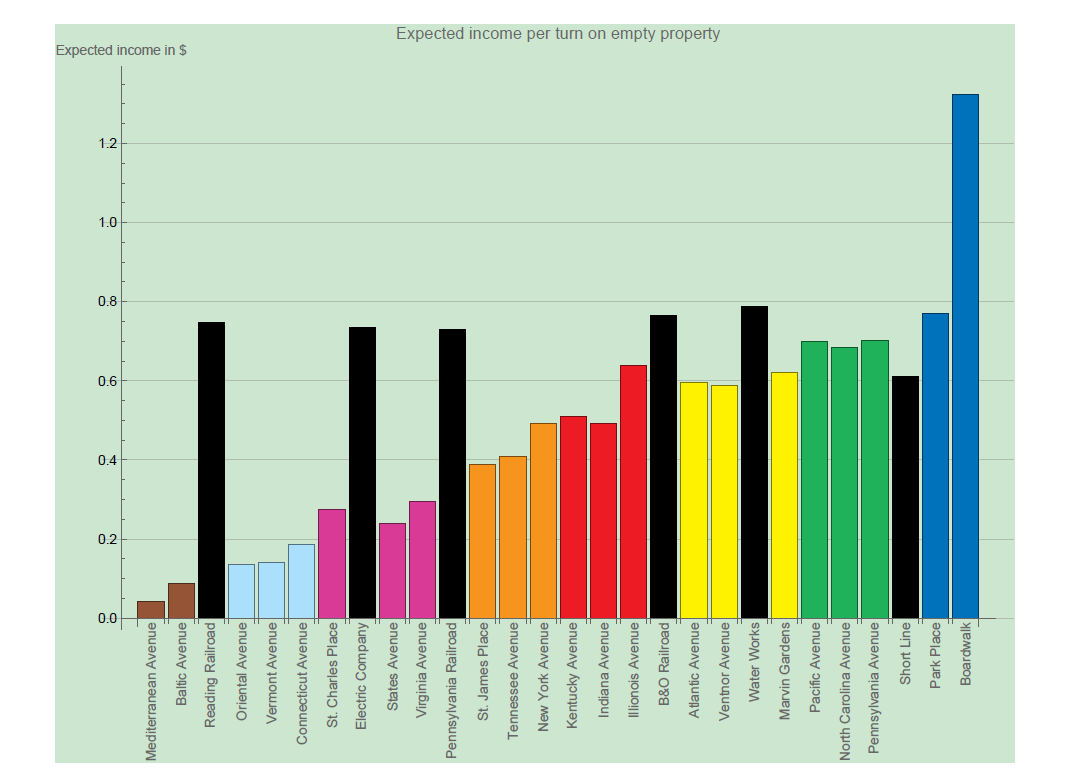
The probabilities of landing on Park Place or either Mediterranean Avenue and Baltic Avenue are similar, but clearly Park Place is more profitable, since if somebody lands on that, we get more money. We can calculate the expected income by multiplying the probability of landing on a square by the rent somebody has to pay when they land on it.
And look at that, Park Place and Boardwalk shoot out as the properties with the most expected income! Other than that, the train stations are also looking really good. This effect disappears when we look at the expected return of fully developed properties, which is something we will look at in just a moment.
Intermezzo: Expected rent value of Utilities
When someone lands on your Electric Company or Water Works, they either pay 4 or 10 times the value of their dice throw, depending on how many Utility properties you own. To calculate the expected rent per turn, we assume you own both the Utilities, so that the 10 times multiplier is always used. What makes calculating the expected return difficult, is that it depends on the dice throw of your opponent, which can be different every time.
To solve this problem, we make a table. First we list all possible dice throws that somebody could throw to land on our Utility square. Underneath that, we list the probabilities of throwing these dice values. The probability of throwing a value of 3 is , since out of all 36 possibilities, there are two ways of throwing a 3: first a 1 and then a 2, or throw a 2 first and then a 1.
Underneath that we list the amount of money somebody has to pay when they land on your Utility square. This is simply 10 times their dice throw. After that we can calculate the expected rent by multiplying the probability by the rent to pay. After that we can add all these values, to obtain an expected rent of $70. Can you calculate the expected rent when you only own one of the utilities?
Dice value
2
3
4
5
6
7
8
9
10
11
12
Probability of value
Rent to pay
20
30
40
50
60
70
80
90
100
110
120
Expected rent
Table: Amount of money somebody has to pay when they land on your Utility square
Fully developed properties
When another player lands on a street you own, they have to pay you rent. The amount of rent depends on how many houses and hotels you have built on that street. If another player lands on your square with a hotel built on it, great news for you! They have to pay you a lot of money. Since you cannot build more on this street, we say this property is fully developed.
Stations and Utilities can also be fully developed. This just means that you own all four Stations, or both of the Utilities.
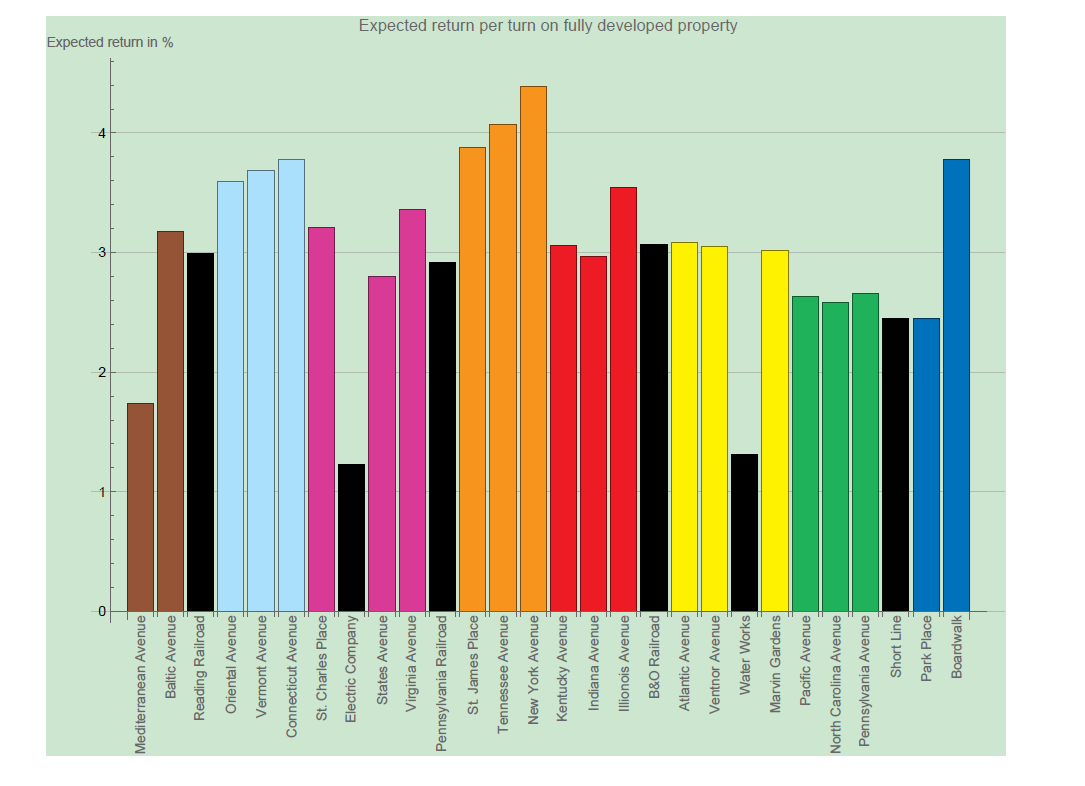
It seems that the further along you get across the board, the more money you can expect to earn. But the properties also get more expensive to buy the further along the board you go, as well as houses and hotels. A house on Baltic Avenue or Vermont Avenue costs only $50, while a house on Pacific Avenue or Boardwalk costs a whopping $200. In other words: we have to take the expenses into account. For this we can use the expected return of a property:
Doing this for all properties which are fully developed gives us the following histogram
Suddenly the Deep Blue properties don’t seem so attractive anymore! Especially Park Place, which is one of the squares with the least amount of return of all properties, only behind Mediterranean Avenue. Out of this a new champion emerges! The orange properties are now looking very attractive. We already saw that the probabilities for these properties were relatively high, and it seems that New York Avenue hits the sweet spot when combining this with the lower prices.
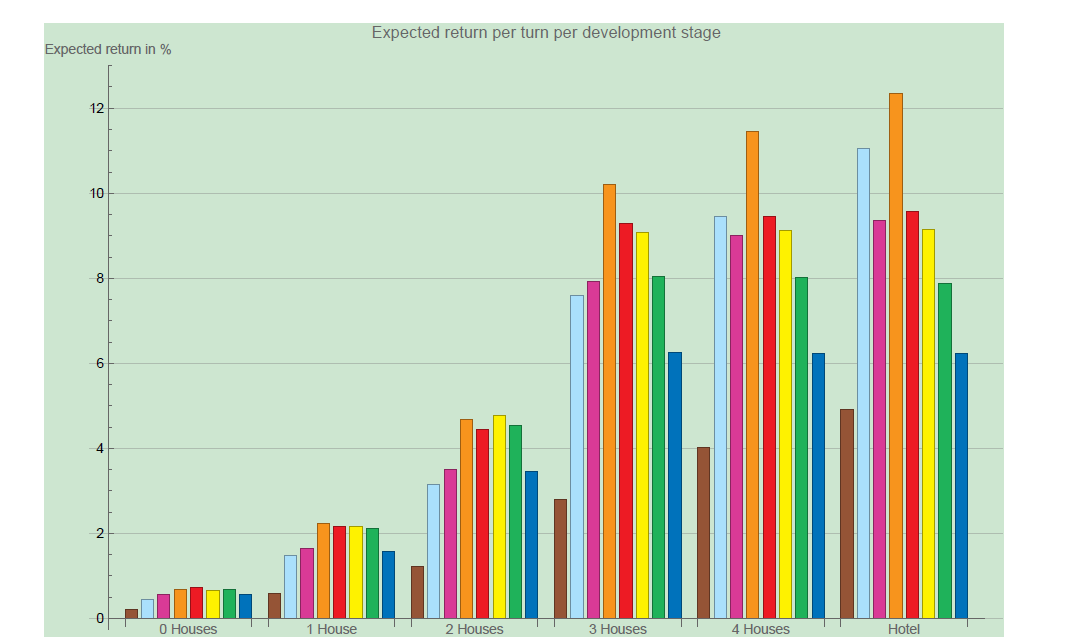
Of course, this all holds for fully developed properties, when in reality one rarely builds hotels in the game. How does this compare to all the different stages of development?
The clear standout here are the Orange properties, but we also see a surprising second place for Light Blue, especially when building more than 2 houses. The Green and Deep Blue now look like terrible investments! When building more than three houses, the expected return actually goes down. To see this more clearly we can look at the change in return:
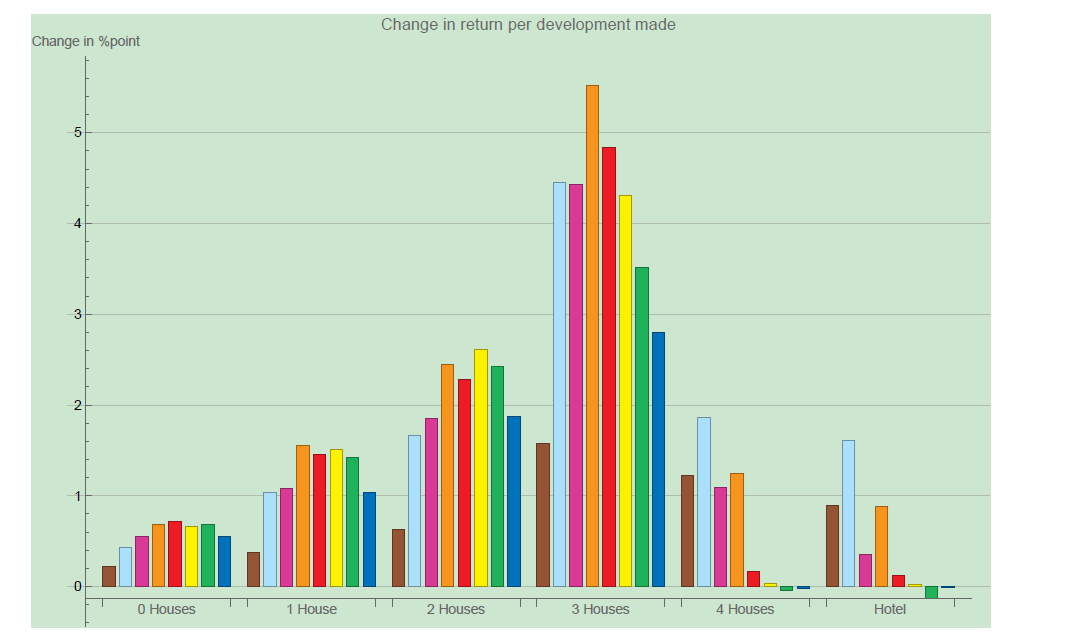
What do we see in this histogram? At '0 Houses' we see the same data as in the histogram before: what is the expected return of all colors. At '1 House', we get the change in expected return: how much extra return we can expect if we go from 0 houses to 1 house. Similarly, the bars above '2 Houses' represent how much extra return we can expected if we go from 1 house to 2 houses on a property. In other words, this graph answers the question: how much does the expected return go up if we build another house or hotel.
How can we use these numbers to win our Monopoly at our next game night? Go for Orange and Light Blue, don’t bother with Brown, Green and Deep Blue. When playing a board game which involves dice or probability, try to see if you can call Mr. Markov for help!
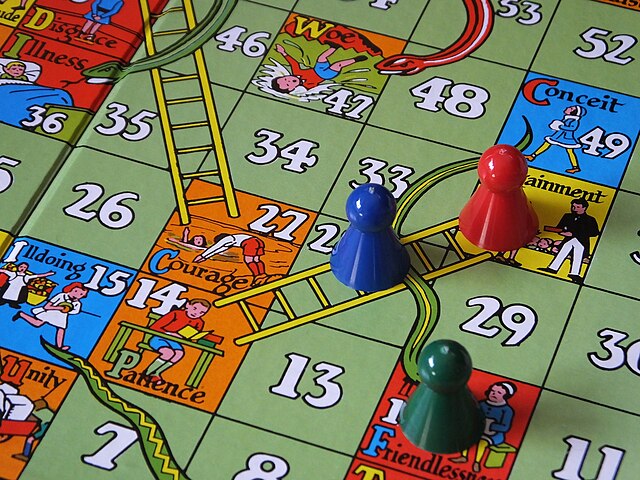
Have you ever wondered what kind of insights you can gain about games by looking at it using a mathematical lens? In this article we have a look at Snakes and Ladders, and in a follow up article we will dive into Monopoly!
We want our guts to be filled with a diverse range of mutually beneficial and competitive interactions, a perfect blend of friends, frenemies, and enemies to keep our guts active and body on its toes. Read how networks can help understand these interactions!
If, after reading the title, your immediate response is to shout "1/6-th", then you have correctly answered the question. Well done! However, in this article we will focus on the meaning of this question. What exactly is this "chance" of which you've just exclaimed it equals 1/6-th?
The scientific world would not be what it is today without normal distribution. It is the foundation of many statistical models for several good reasons. Most importantly, it appears commonly in nature. But this is only the tip of the iceberg.
 for this game.
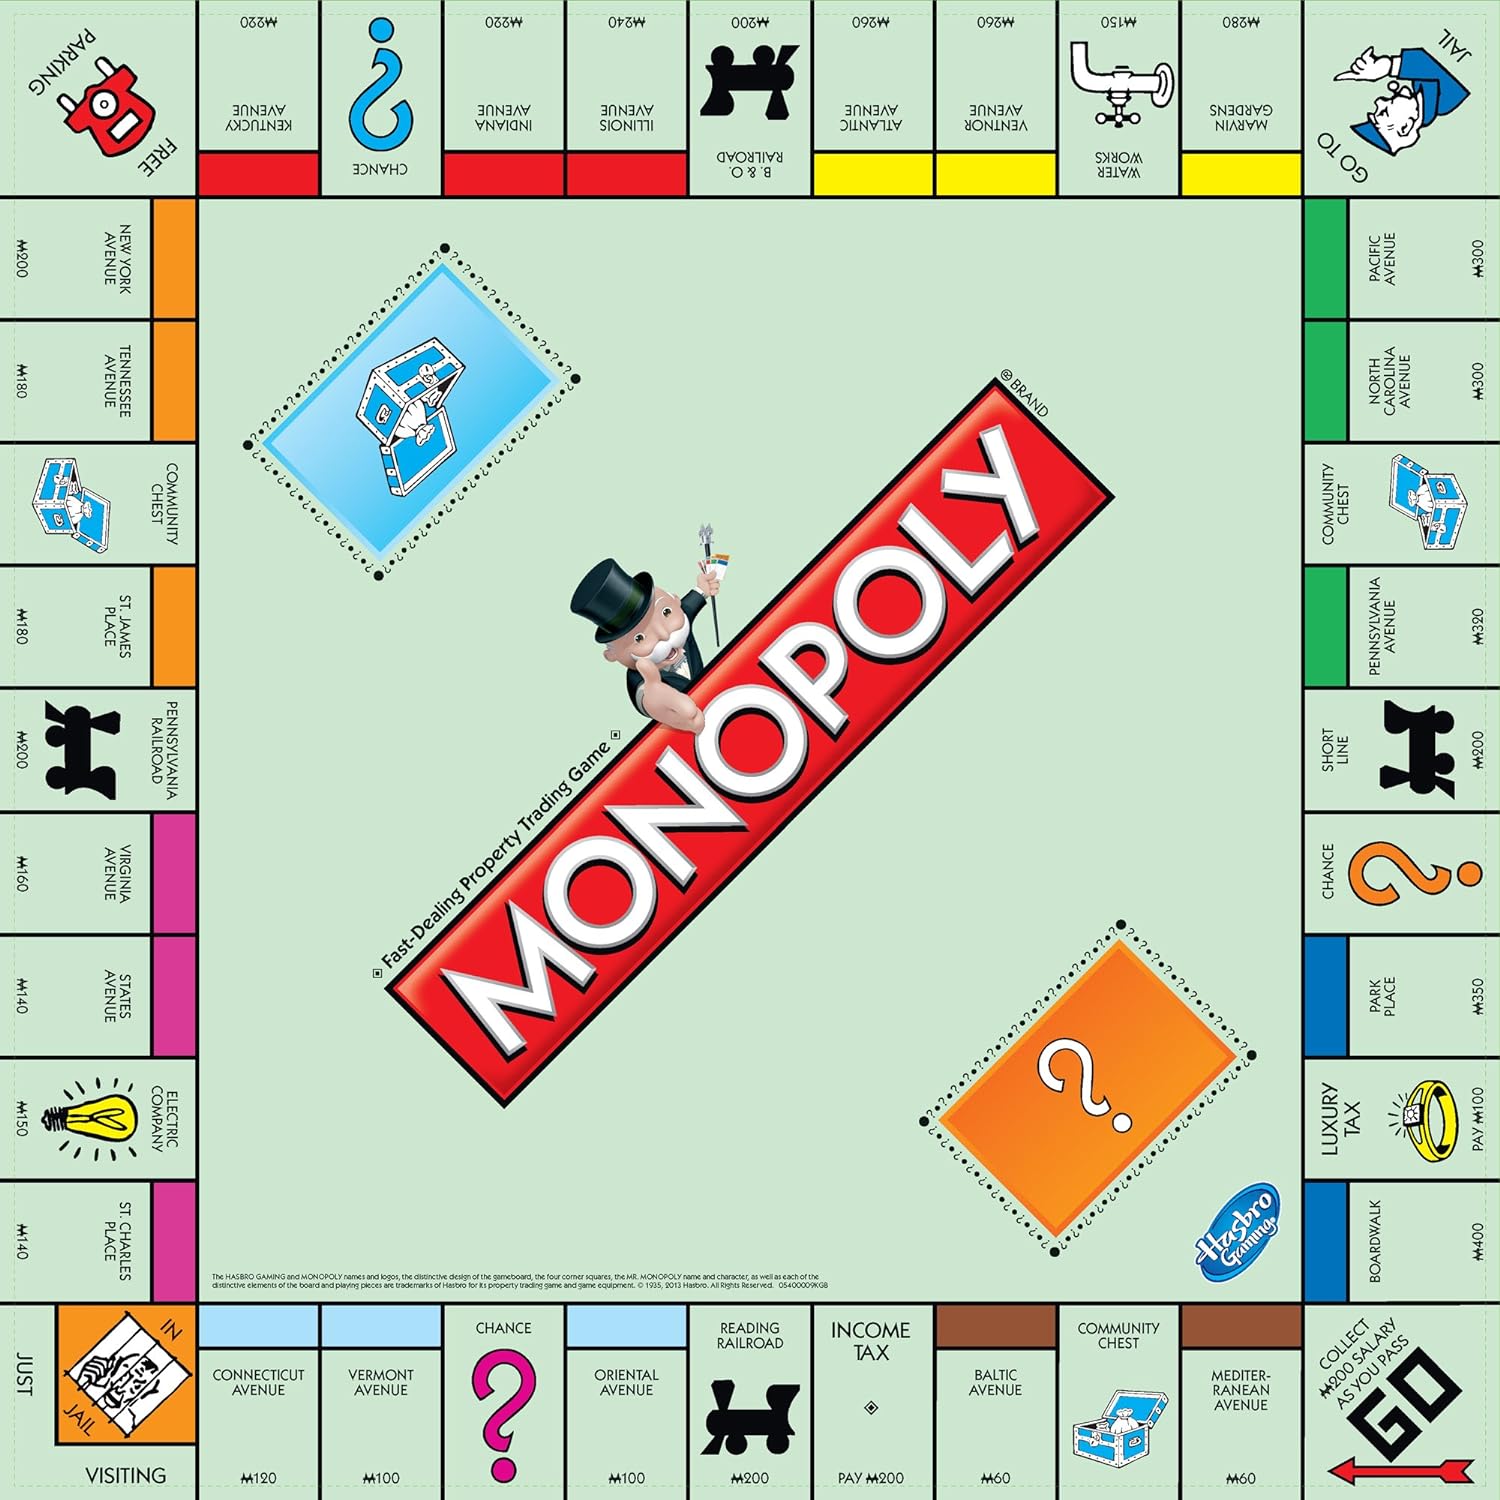
 , by throwing two 1’s. The probability of throwing a 7 is much higher,
  , since we can throw 7 in six different ways. Can you list all possible ways to do this?
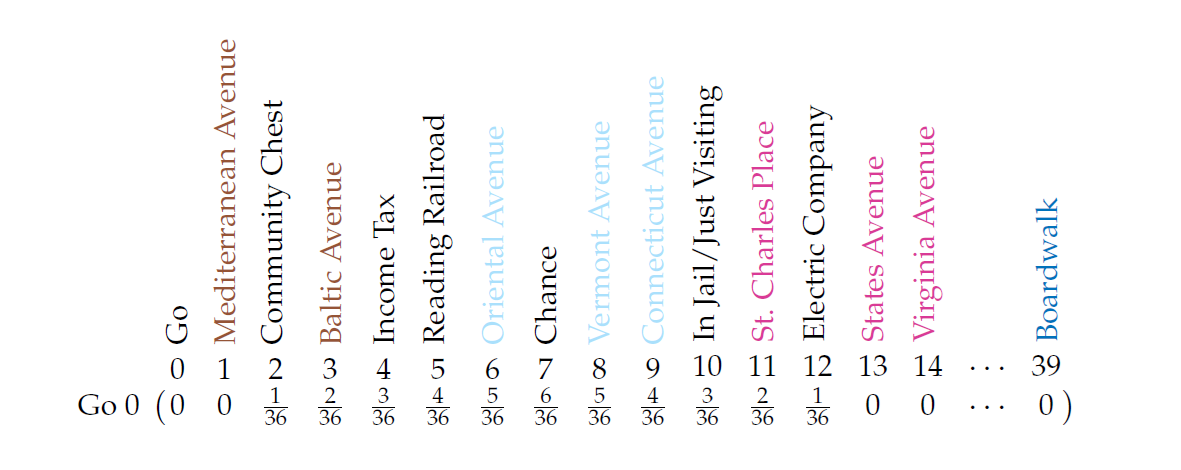
 chance that the card tells us to stay put, a
  chance that you have to go to Jail and a
  . Then we also have a
  chance that we end up in Jail and a
  that we end up on the Jail square (by just visiting), so the total probability of ending up on the Jail square becomes
  In the matrix this looks like this:
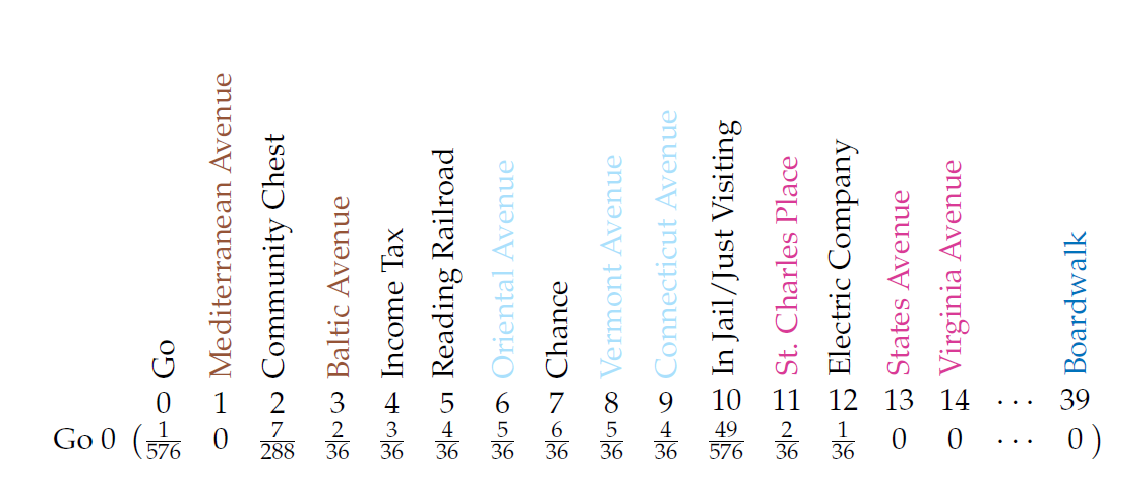
 matrix. We won’t explore this version of the Markov chain, but you can try to write it down yourself!
 . We can add to this the probability of going from Mediterranean Avenue to Go. But we also need to add the probability of going from Community Chest to Go. In other words, we need to add all probabilities of going from any square to Go, which is the same as adding up all probabilities in
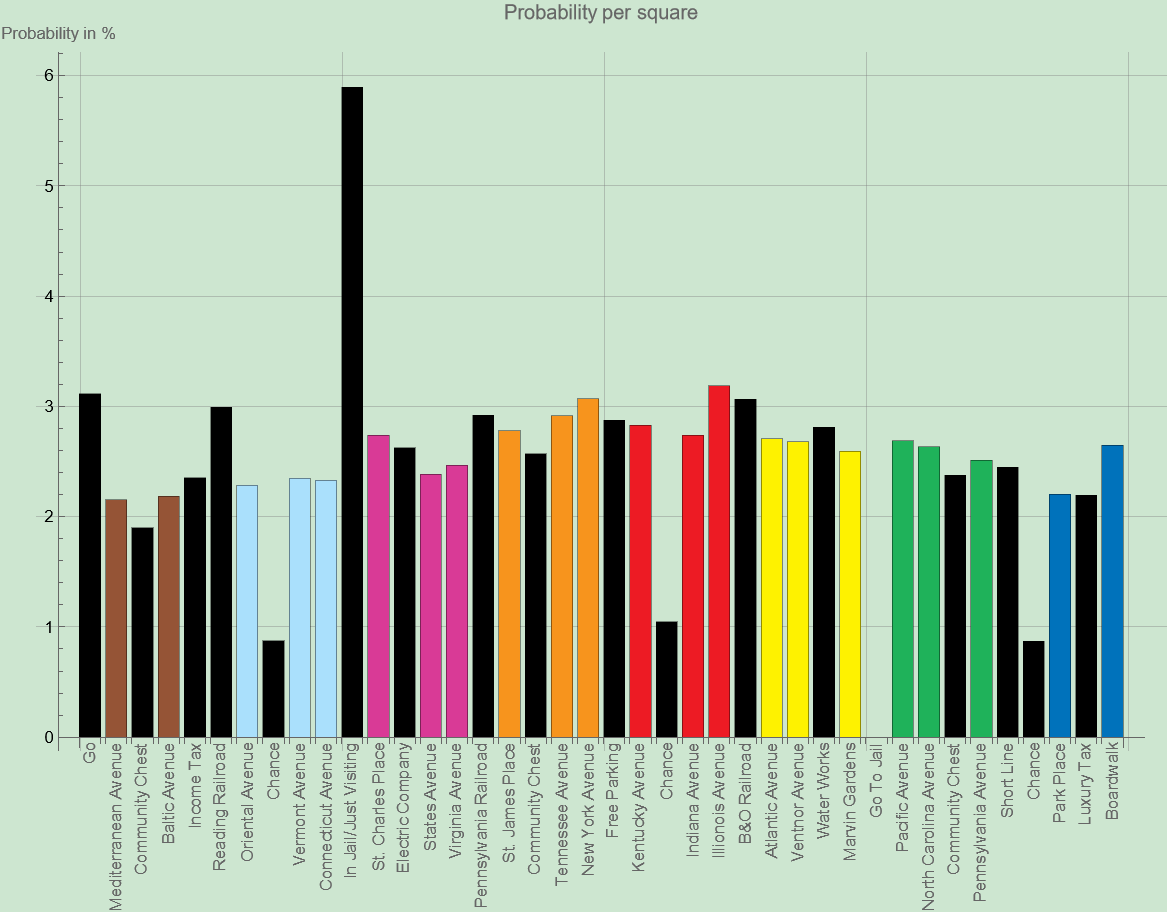
 , since out of all 36 possibilities, there are two ways of throwing a 3: first a 1 and then a 2, or throw a 2 first and then a 1.


 20
20