In this category we gather science illustations on various topics related to networks and algorithms. Many of these illustrations were developed specifically for the Network Pages.
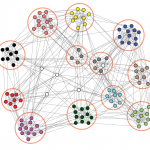
To find the network communities, we need a mathematical equation that describes when a division of the network into communities meets these two criteria.
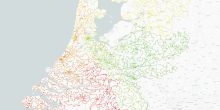
Using data analytic techniques and Artificial Intelligence you can analyse data from hospitals and discover hidden patterns that allow us to often predict (within a margin of accuracy) failures before they happen. When a failure is predicted, we issue an alert and we plan for preventive maintenance by an expert engineer.
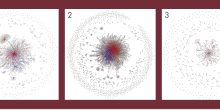
Network visualizations have the power to display how we communicate with each other in social media. We can simply depict message exchanges using communication networks. In such a network, nodes represent users, and there exists an edge between two nodes when the corresponding users exchange information (an email or a tweet).
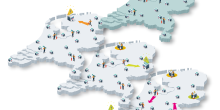
Suppose you have a delivery service. You have one truck and have to deliver a large number of parcels to different cities in the country every day. Then you run into the following problem: in which order should you visit the cities?
EWM-NL has prepared a poster about women in mathematics, inspired by a poster on Notable Women in Computing. In this article you can find the beautiful poster, prepared by a joint Dutch and UK team comprising Maria Vlasiou and Silvy Hendriks (NL), and Houry Melkonian.